Characterising the heat islands induced by data centers
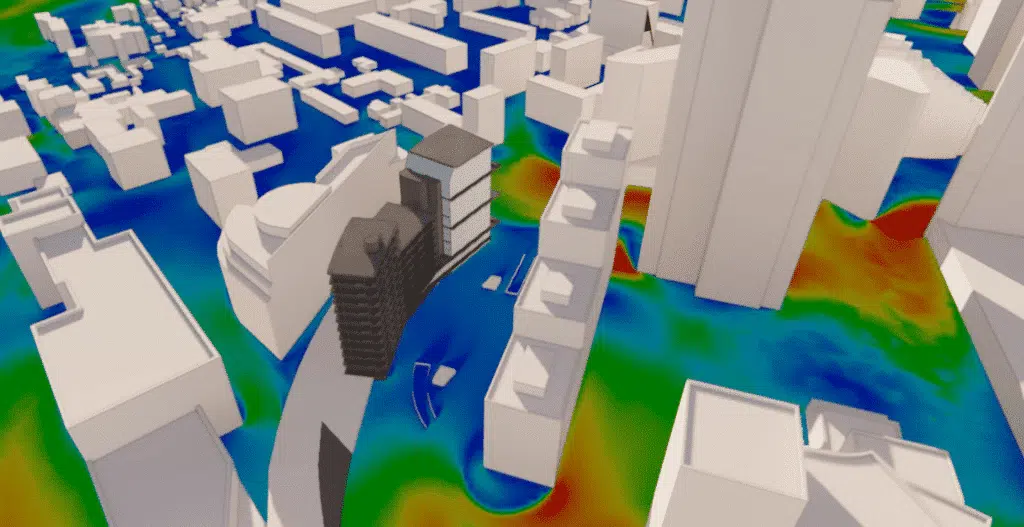
The urban heat island effect is the temperature difference observed between a city and its rural surroundings. Materials, dense urbanisation and the lack of vegetation trap heat, creating the “heat bubble” typical of city centres — to which data centers contribute through their thermal discharges.
Characterisation
- Identification of the heat islands
- Thermal impact in real weather
- Discharges, urban morphology, ventilation
Scenarios
- Cumulative effects of several sources
- Dispersion according to siting scenarios
- Seasonal & hourly variability
Decision
- Comparison of mitigation solutions
- Greening, ventilated facades, heat recovery
- Support for development decisions
This residual heat, if not recovered, raises local daytime and nighttime temperatures, increases the cooling needs of neighbours and affects the comfort of residents, the air quality and the energy consumption of the surrounding buildings.
Mapping of the thermal-influence zones
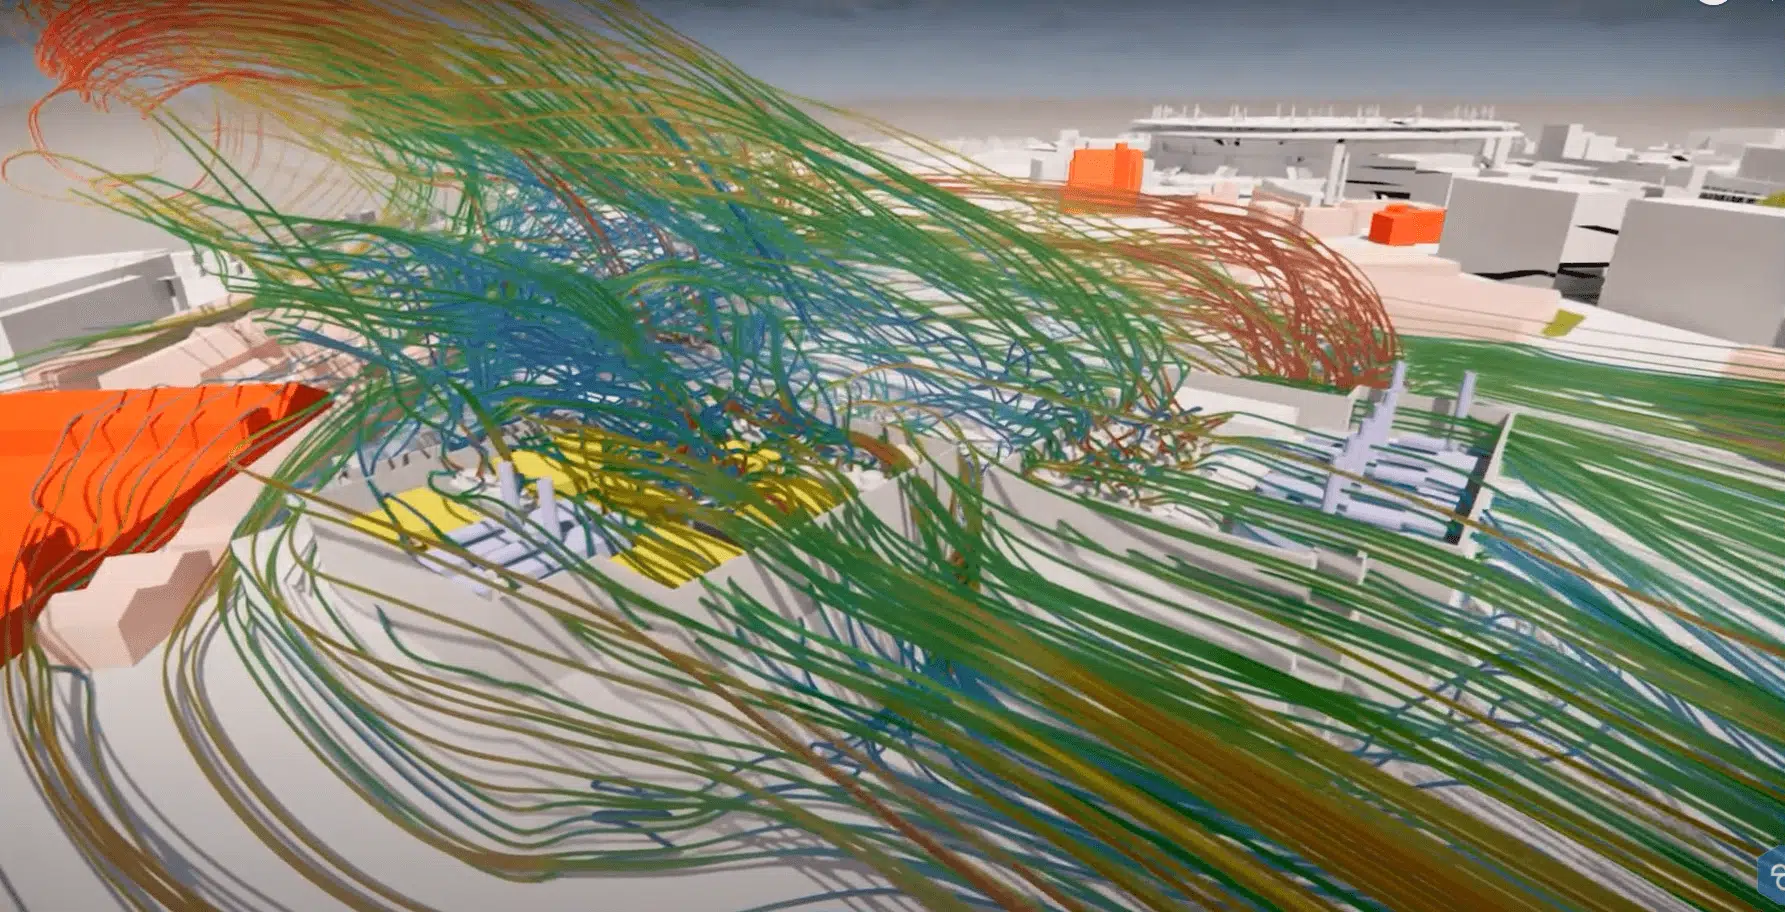
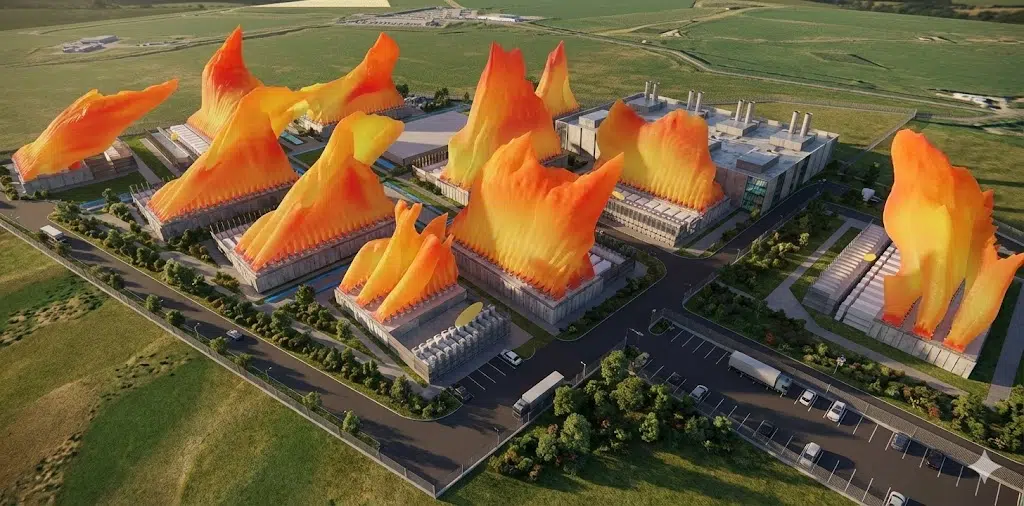
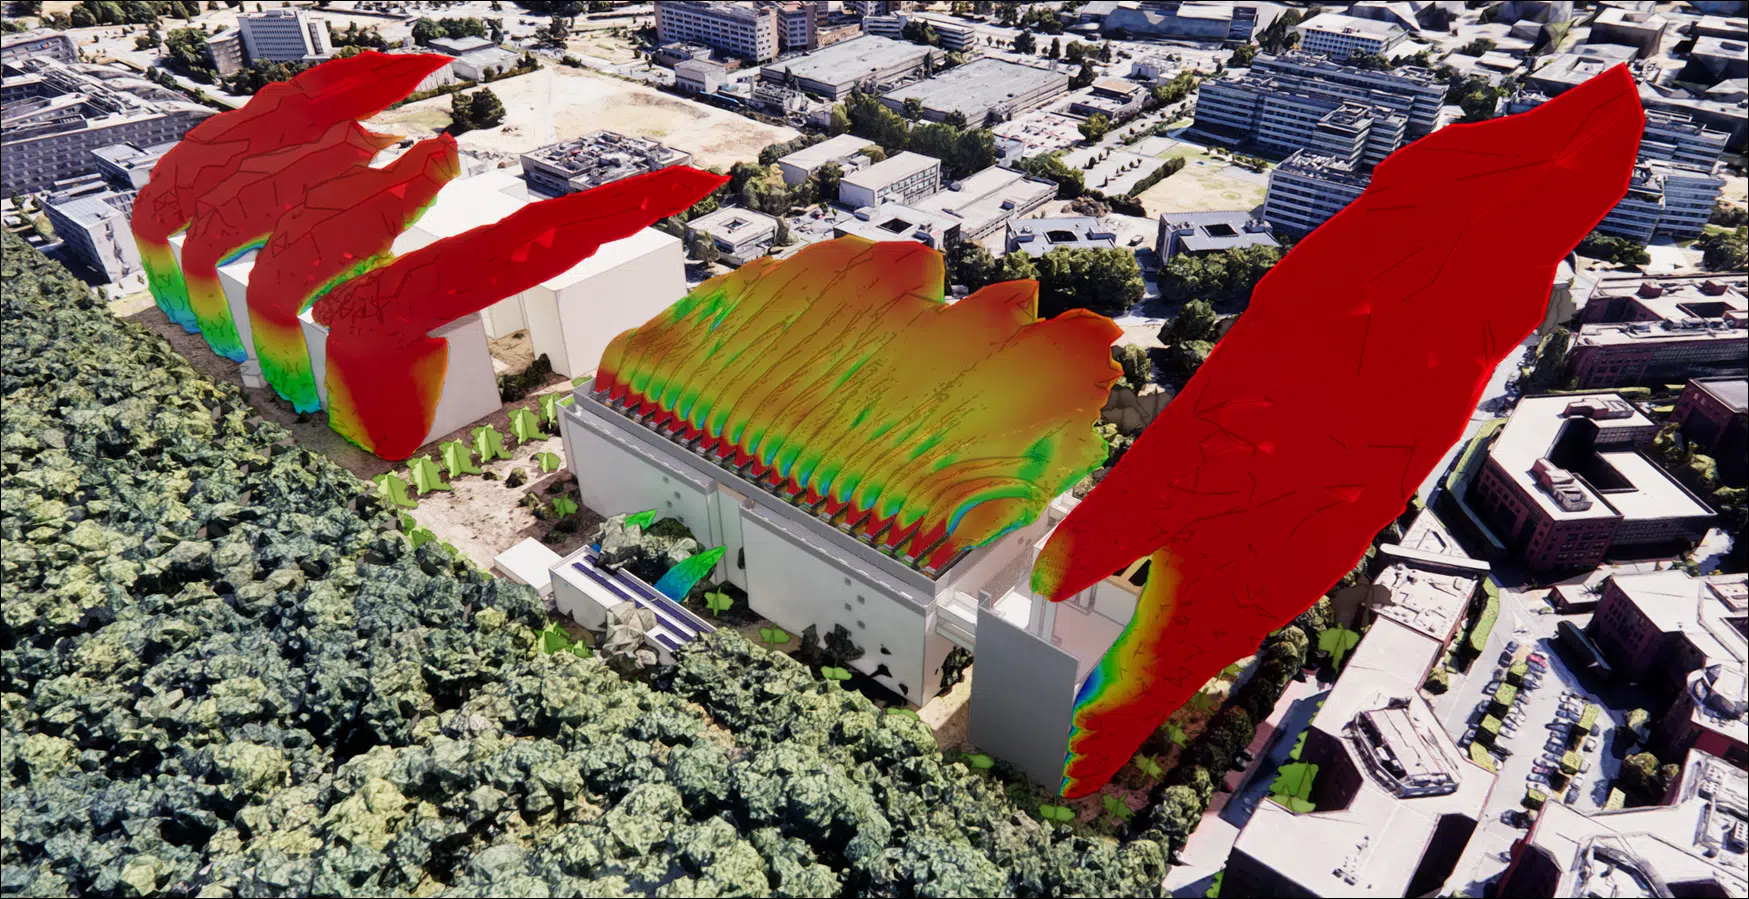
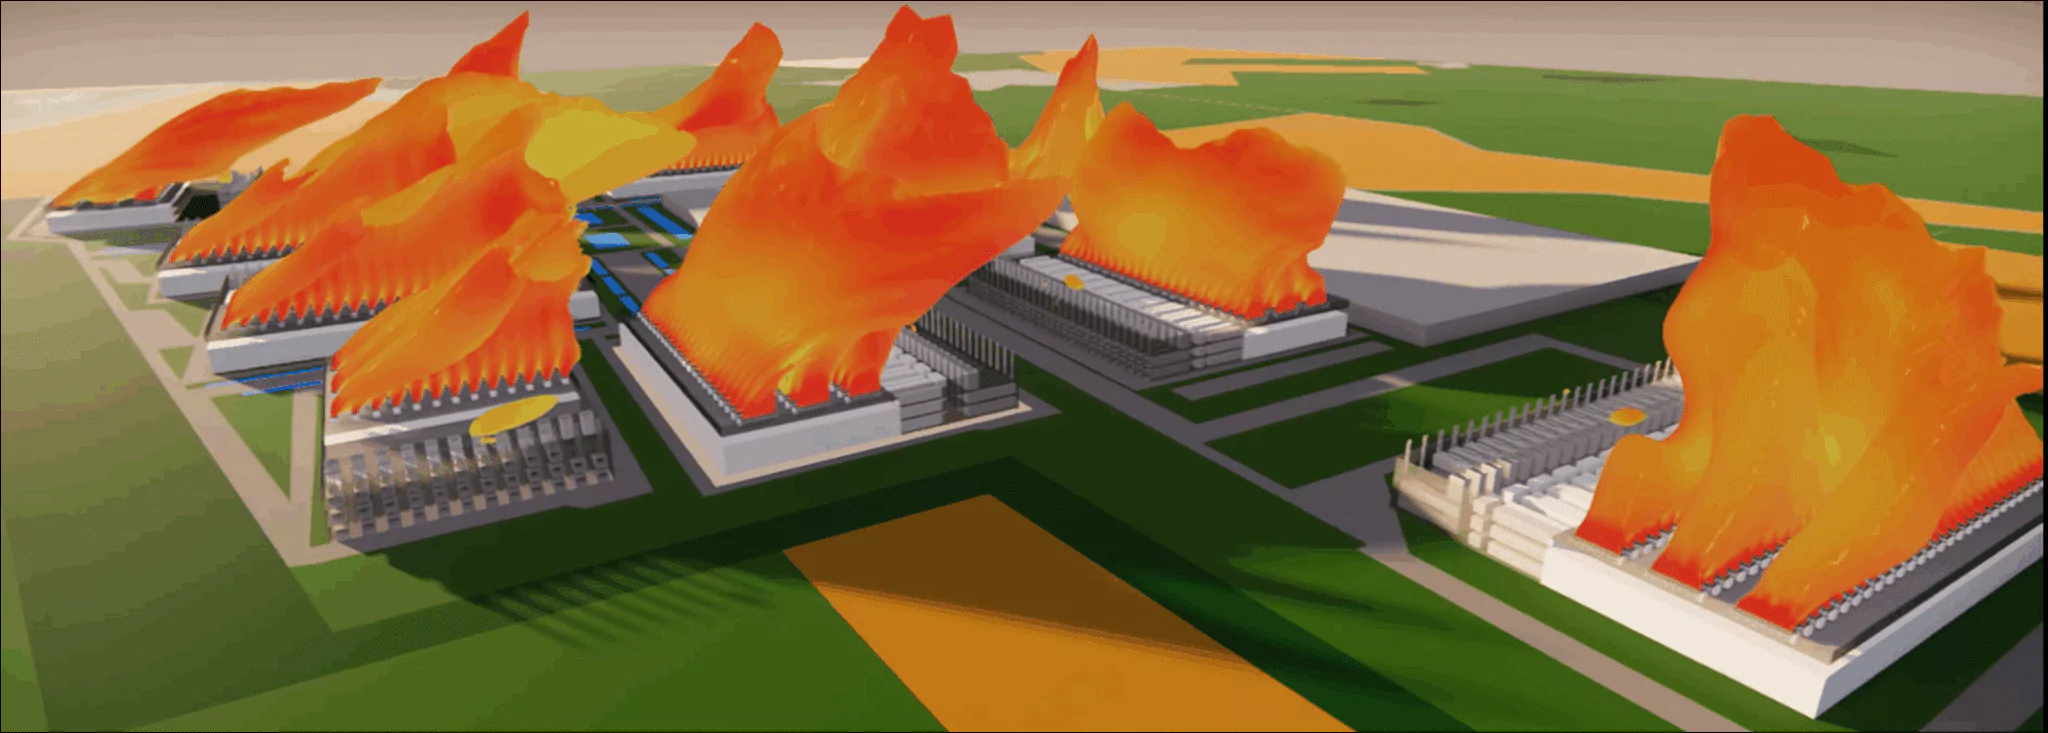
Our CFD simulations finely characterise the heat plumes by integrating the specifics of the site (geometry, topography, layout) and the real conditions (prevailing winds, solar orientation, humidity). These 3D models reproduce the propagation of the hot air, its dilution in the atmosphere and its interactions with the urban fabric (facades, streets, trees, roofs). The reach of a plume can attain 150 m under low wind speed.
Seasonal and hourly variability
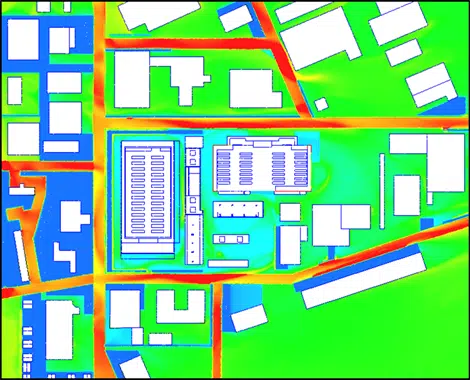
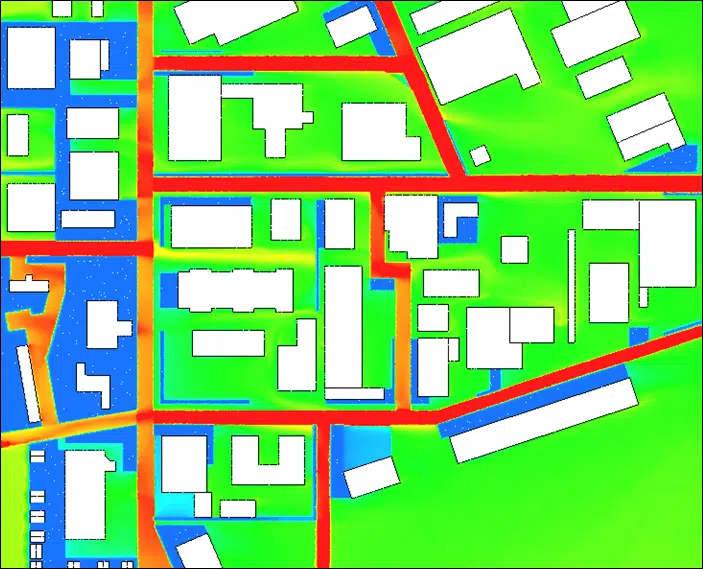
The thermal effect is not constant: it varies with the IT power, the chiller regime, the weather and the urban density. In summer, intense heat and stagnant air cause a significant heat build-up, especially at the end of the day or at night. Our simulations model different scenarios (heatwave day, mid-season, calm windless night) to identify the critical periods and quantify the thermal differences.
Urban integration of the heat-rejection equipment
Orientation, siting and materials
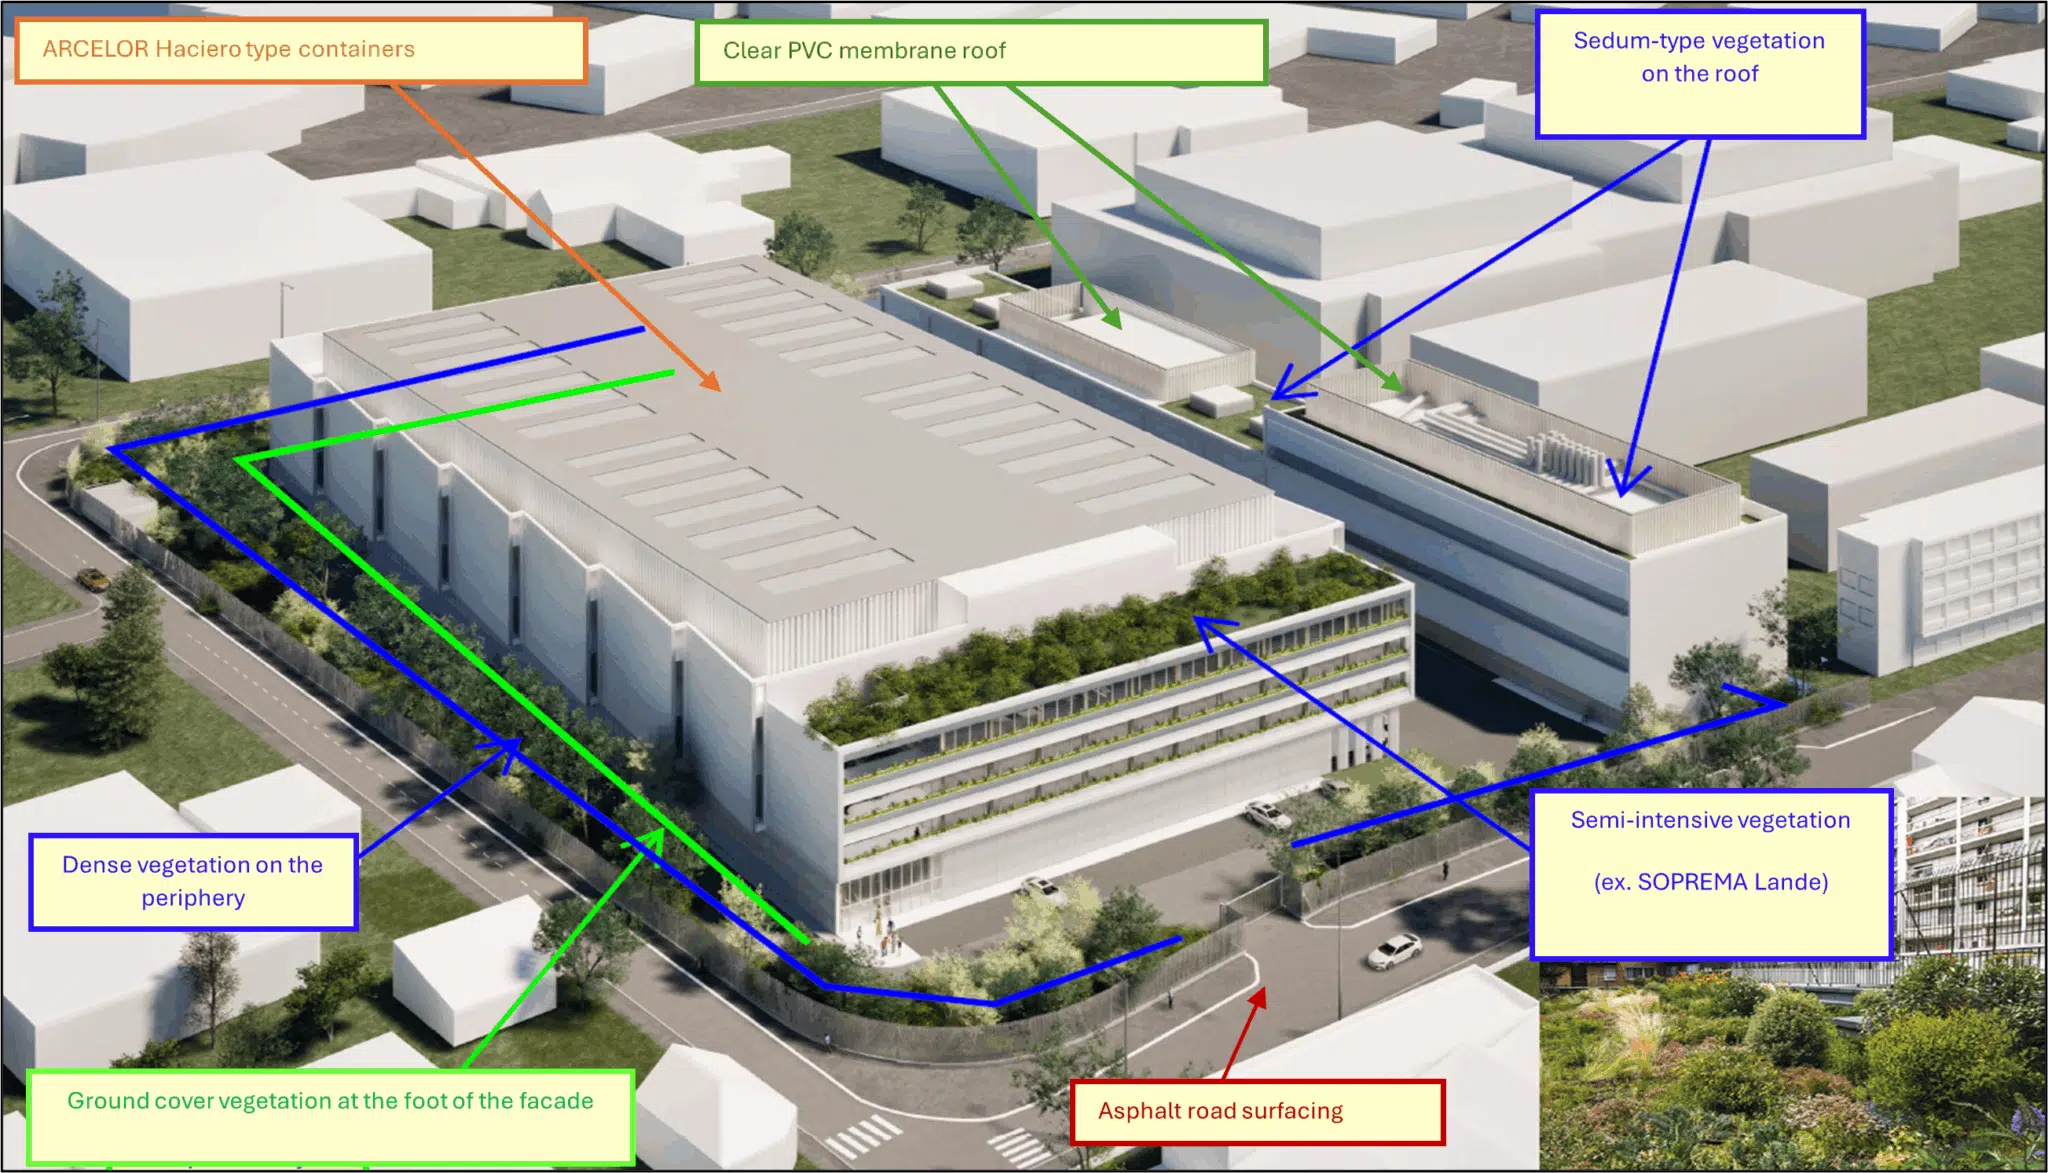
The position, orientation and layout of the dry coolers, condensers and cooling towers play a decisive role in heat diffusion. Poor siting accentuates the UHI, disrupts outdoor comfort or causes the recirculation of hot air into the fresh-air intakes. The materials (concrete, asphalt, dark tiles, metal cladding) store heat during the day and release it at night — a thermal inertia that keeps temperatures high even without direct sunlight.
Height and shape of the thermal plumes
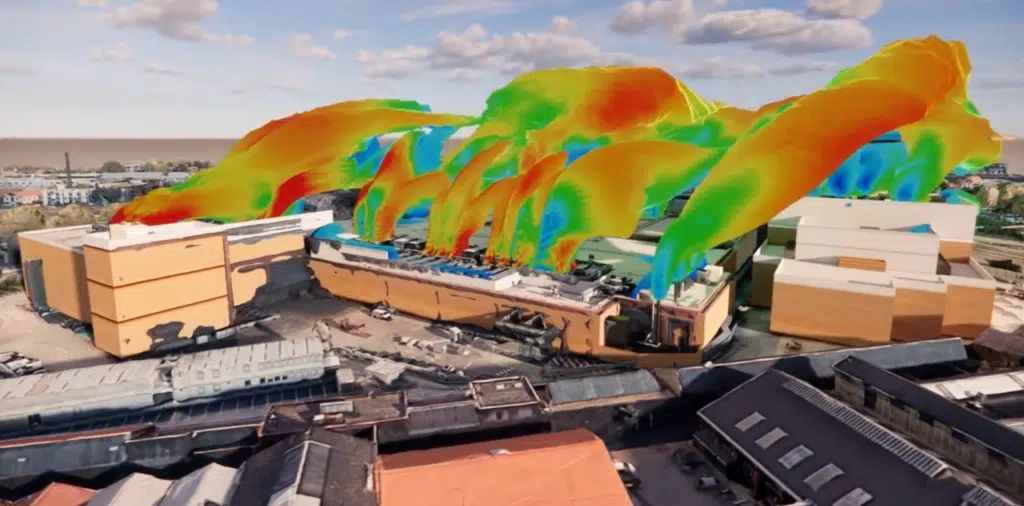
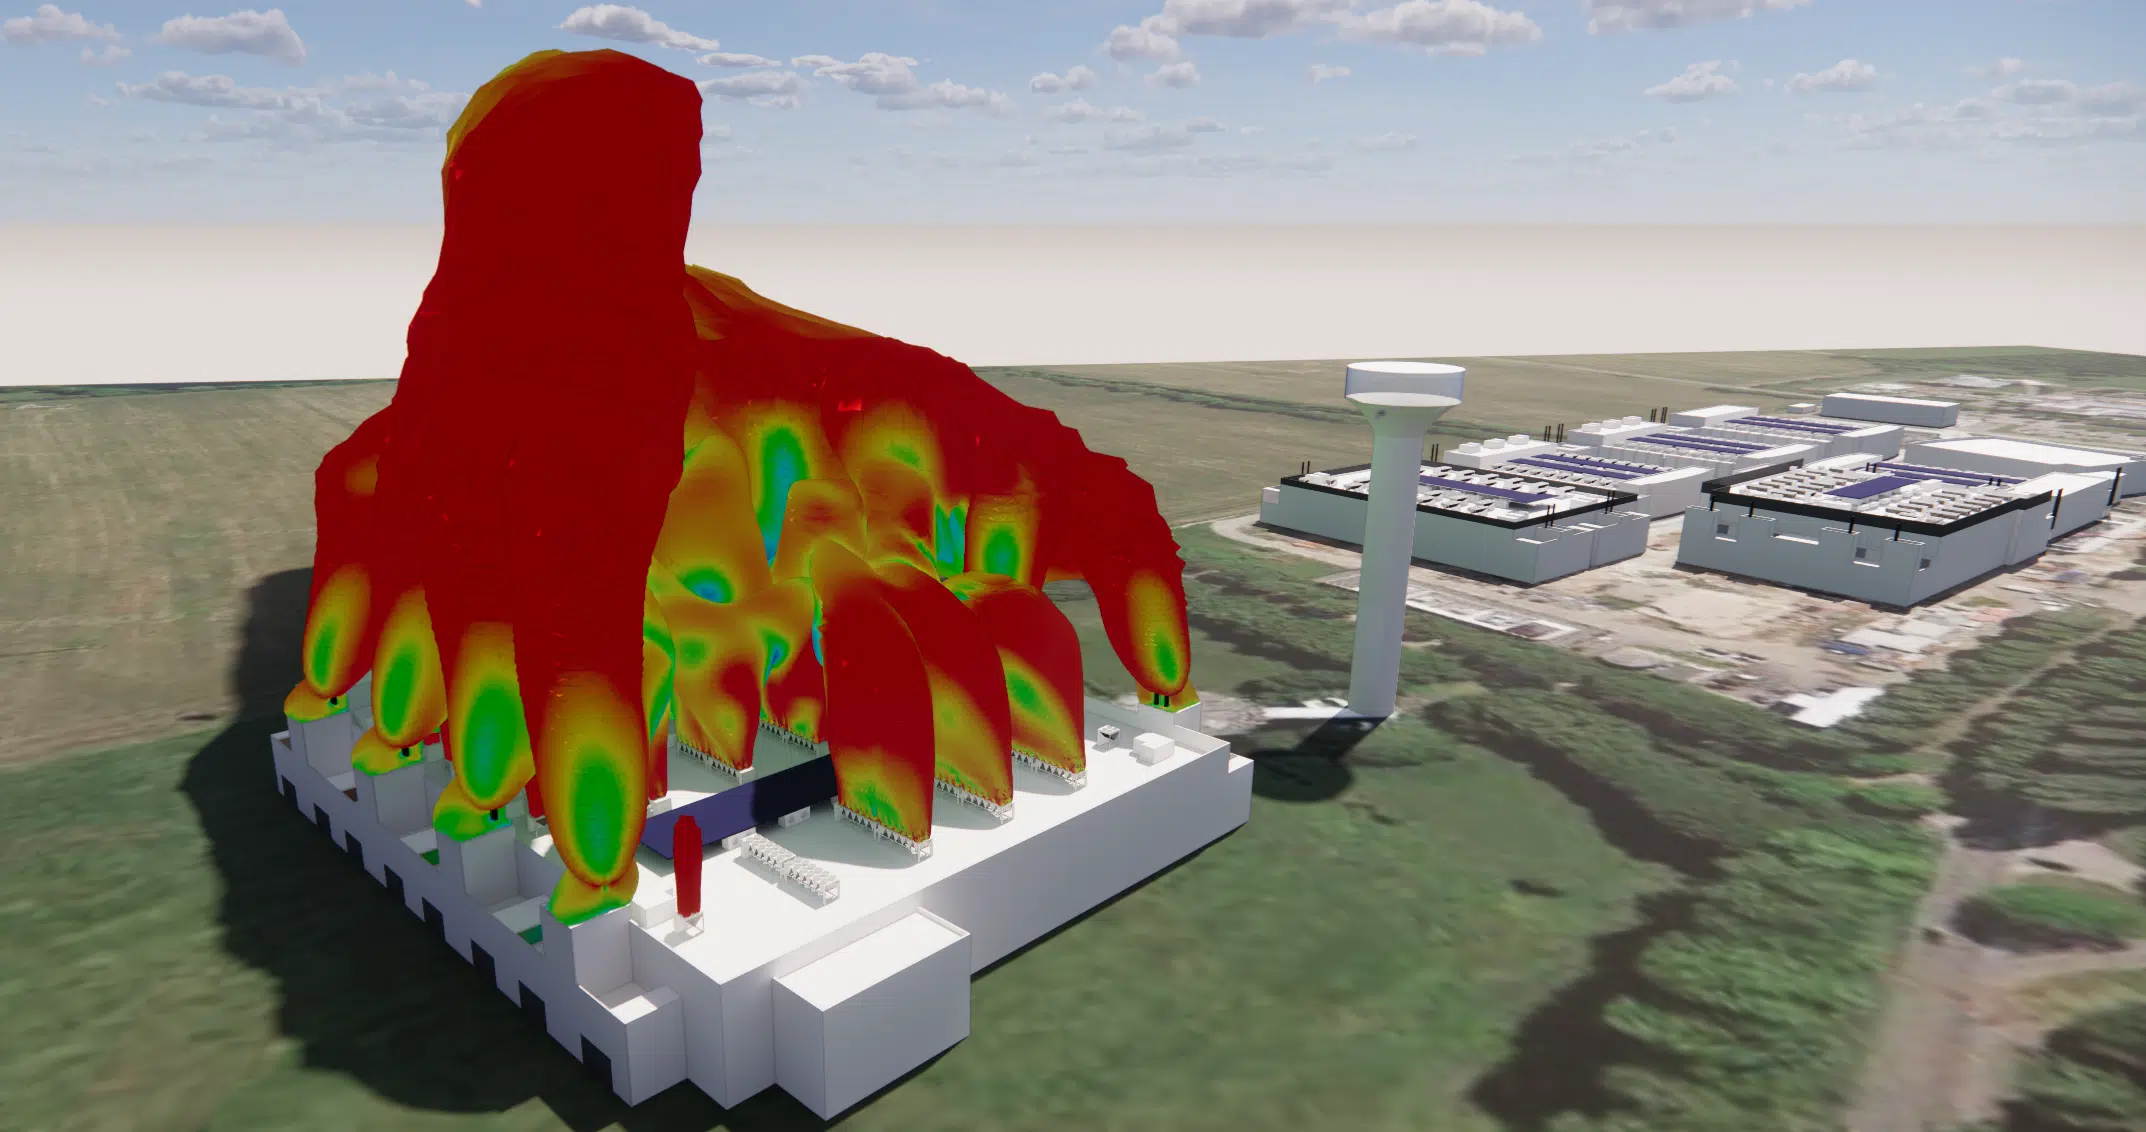
The shape and vertical extent of the plumes depend on the discharge temperature, the rejection velocity, the size of the outlets, the turbulence and the stability of the air. Our CFD simulations visualise the plumes in 3D, assess their reach and determine their impact on the sensitive zones. We then propose adjustments (raising, deflectors, vegetation screens) that can reduce the local thermal impact by 30 to 60%.
Interactions with the surrounding buildings
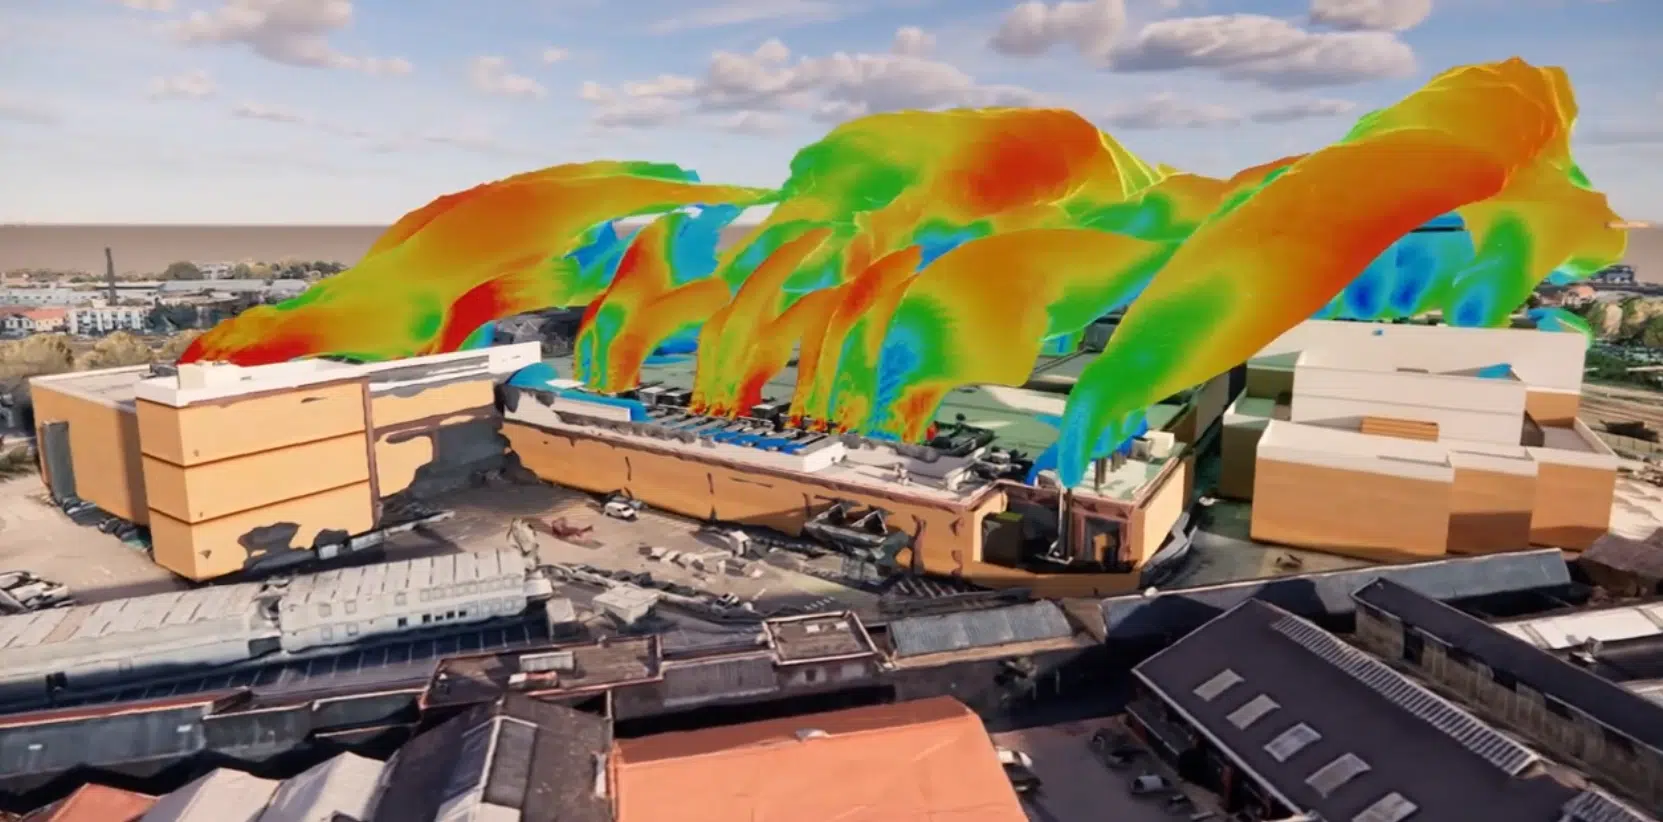
The dense urban environment acts as a heat trap, limiting dispersion and favouring recirculation on neighbouring facades and air intakes. Our CFD analyses reveal the hot flows reaching openings, glazing and AHU air inlets. Our recommendations fit into an environmental-optimisation approach, in line with the HQE/BREEAM standards and the local climate plan (PCAET), for a sustainable coexistence between digital performance and urban quality of life.
Mitigation solutions & environmental compliance
Improving rejection performance
The thermal impact is reduced through a combination of technological choices, operational optimisations and airflow design. Variable-speed dry coolers adapt dynamically to the conditions; deflectors and windbreaks channel the discharges towards less sensitive zones; thermal silencers and dissipation grilles promote rapid mixing with the ambient air, lowering the perceived temperature by 1 to 2 °C at 5 m. Each lever is ranked by its effectiveness, cost and operational compatibility, in a global-performance approach (PUE, comfort, regulation).
Compliance with environmental requirements
The European Energy Efficiency Directive imposes, from 2024, enhanced monitoring of data centers over 500 kW (annual reporting on the rejected-air temperature, the waste-heat utilisation rate and the PUE). Our CFD studies anticipate these requirements by modelling the plumes and their diffusion, and can integrate projected climate scenarios (RCP 4.5 or 8.5) to guarantee long-term compliance. In the Paris region, our deliverables align with the objectives of the regional Climate Plan and feed into building-permit, impact-study or HQE, BREEAM or ISO 50001 certification processes.
Consultation & responsible data centers
Support for consultation with local residents
The urban integration of a data center is also social and territorial. The perception of thermal nuisances can raise concerns. EOLIOS develops legible thermal maps, 3D plume animations and visual summaries suited to public presentations and consultation workshops, translating the potential impacts into concrete elements (local temperature rise, modified wind speed, facade warming). Thanks to synthetic indicators (temperature differences 1.5 m above ground, exceedance of comfort thresholds per EN ISO 7730), our studies make the debates objective and reassure stakeholders.
Towards more responsible data centers
Reducing thermal discharges is not only about meeting a regulatory constraint: it is the choice of a more virtuous infrastructure. In Paris, where the urban heat island can add +2 to +3 °C in summer, limiting heat inputs is a major challenge for comfort and climate resilience. EOLIOS supports its clients in the energy recovery of the discharges through hybrid solutions (greening, passive cooling, architectural integration), positioning data centers as responsible players in the sustainable city.