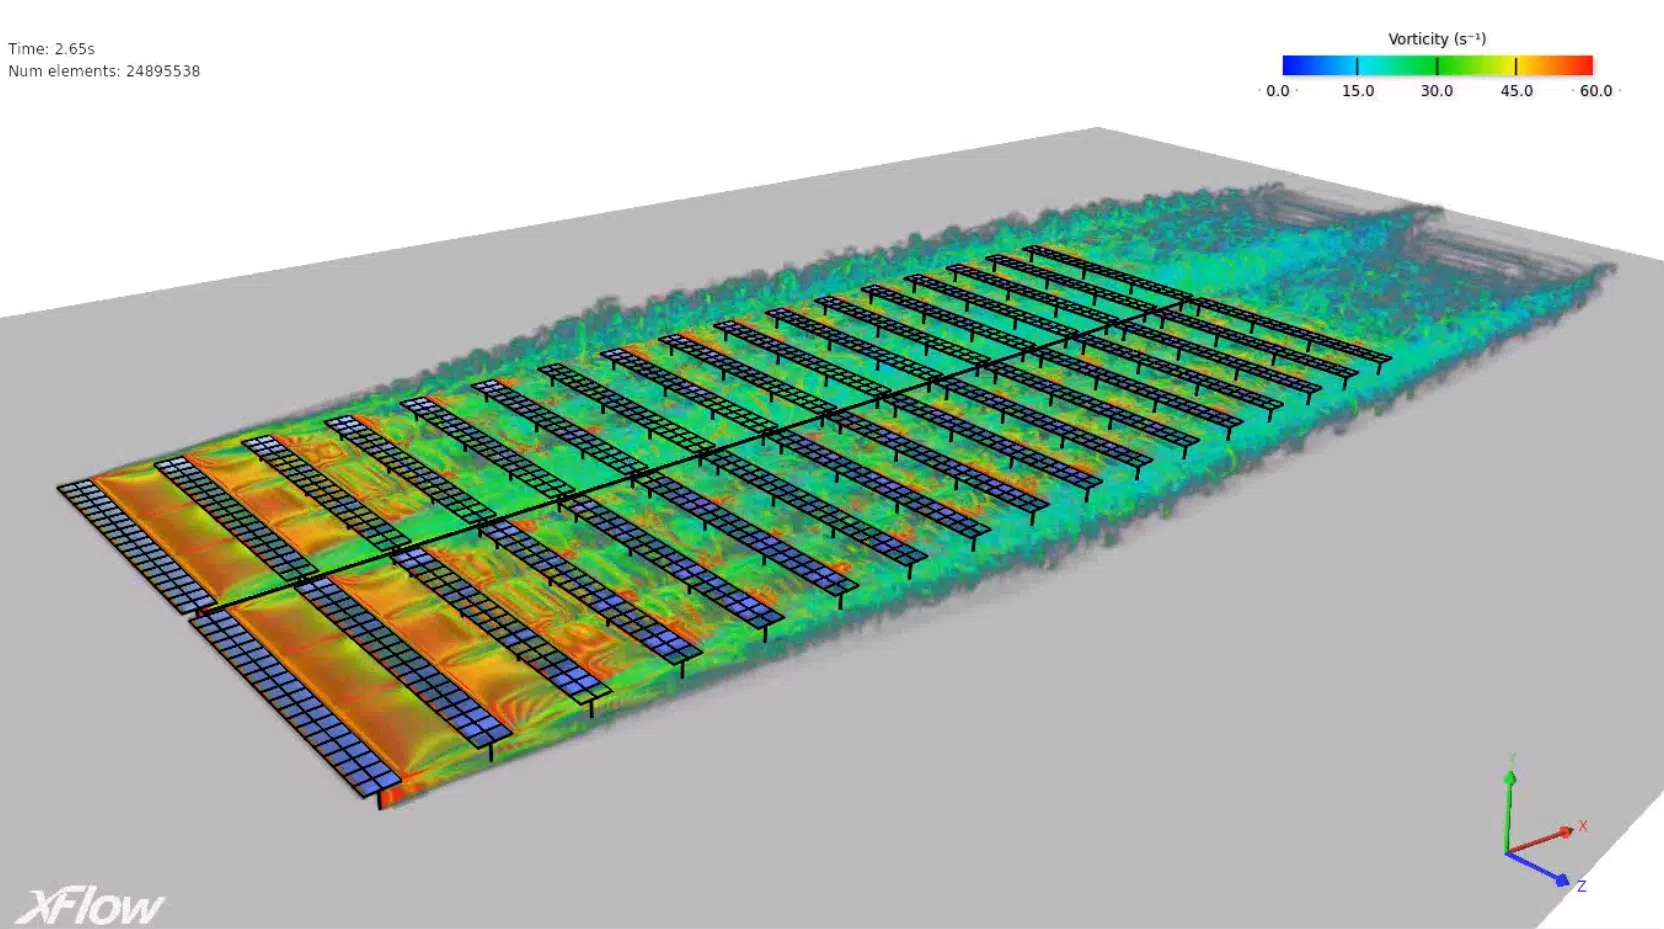
Why map wind pressures
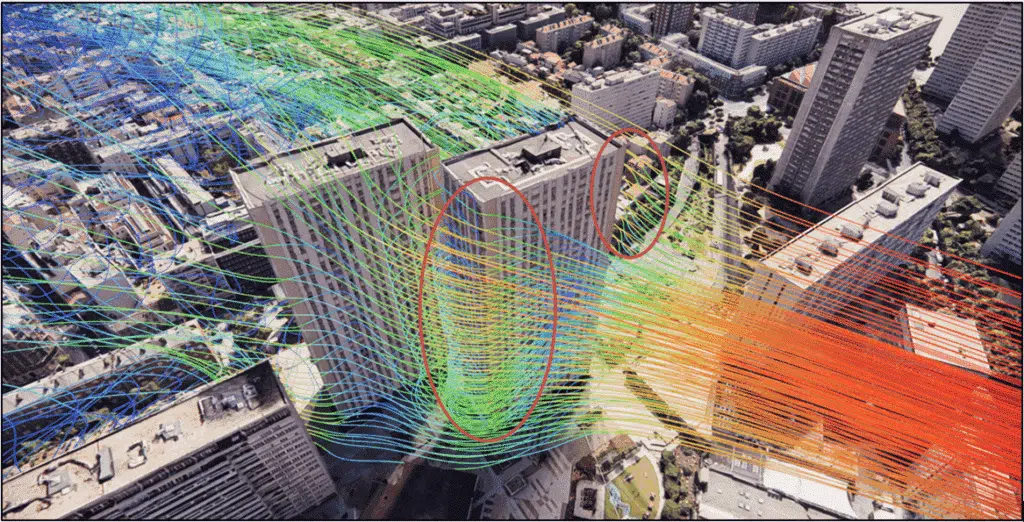
When wind meets a building, it does not simply "push": it creates a complex pressure field — overpressure on the exposed face, suction on the sides, the roof and the leeward face. This field governs three major issues.
Structural loads
- Forces on façades, roofs, glazing and fixings.
Natural ventilation
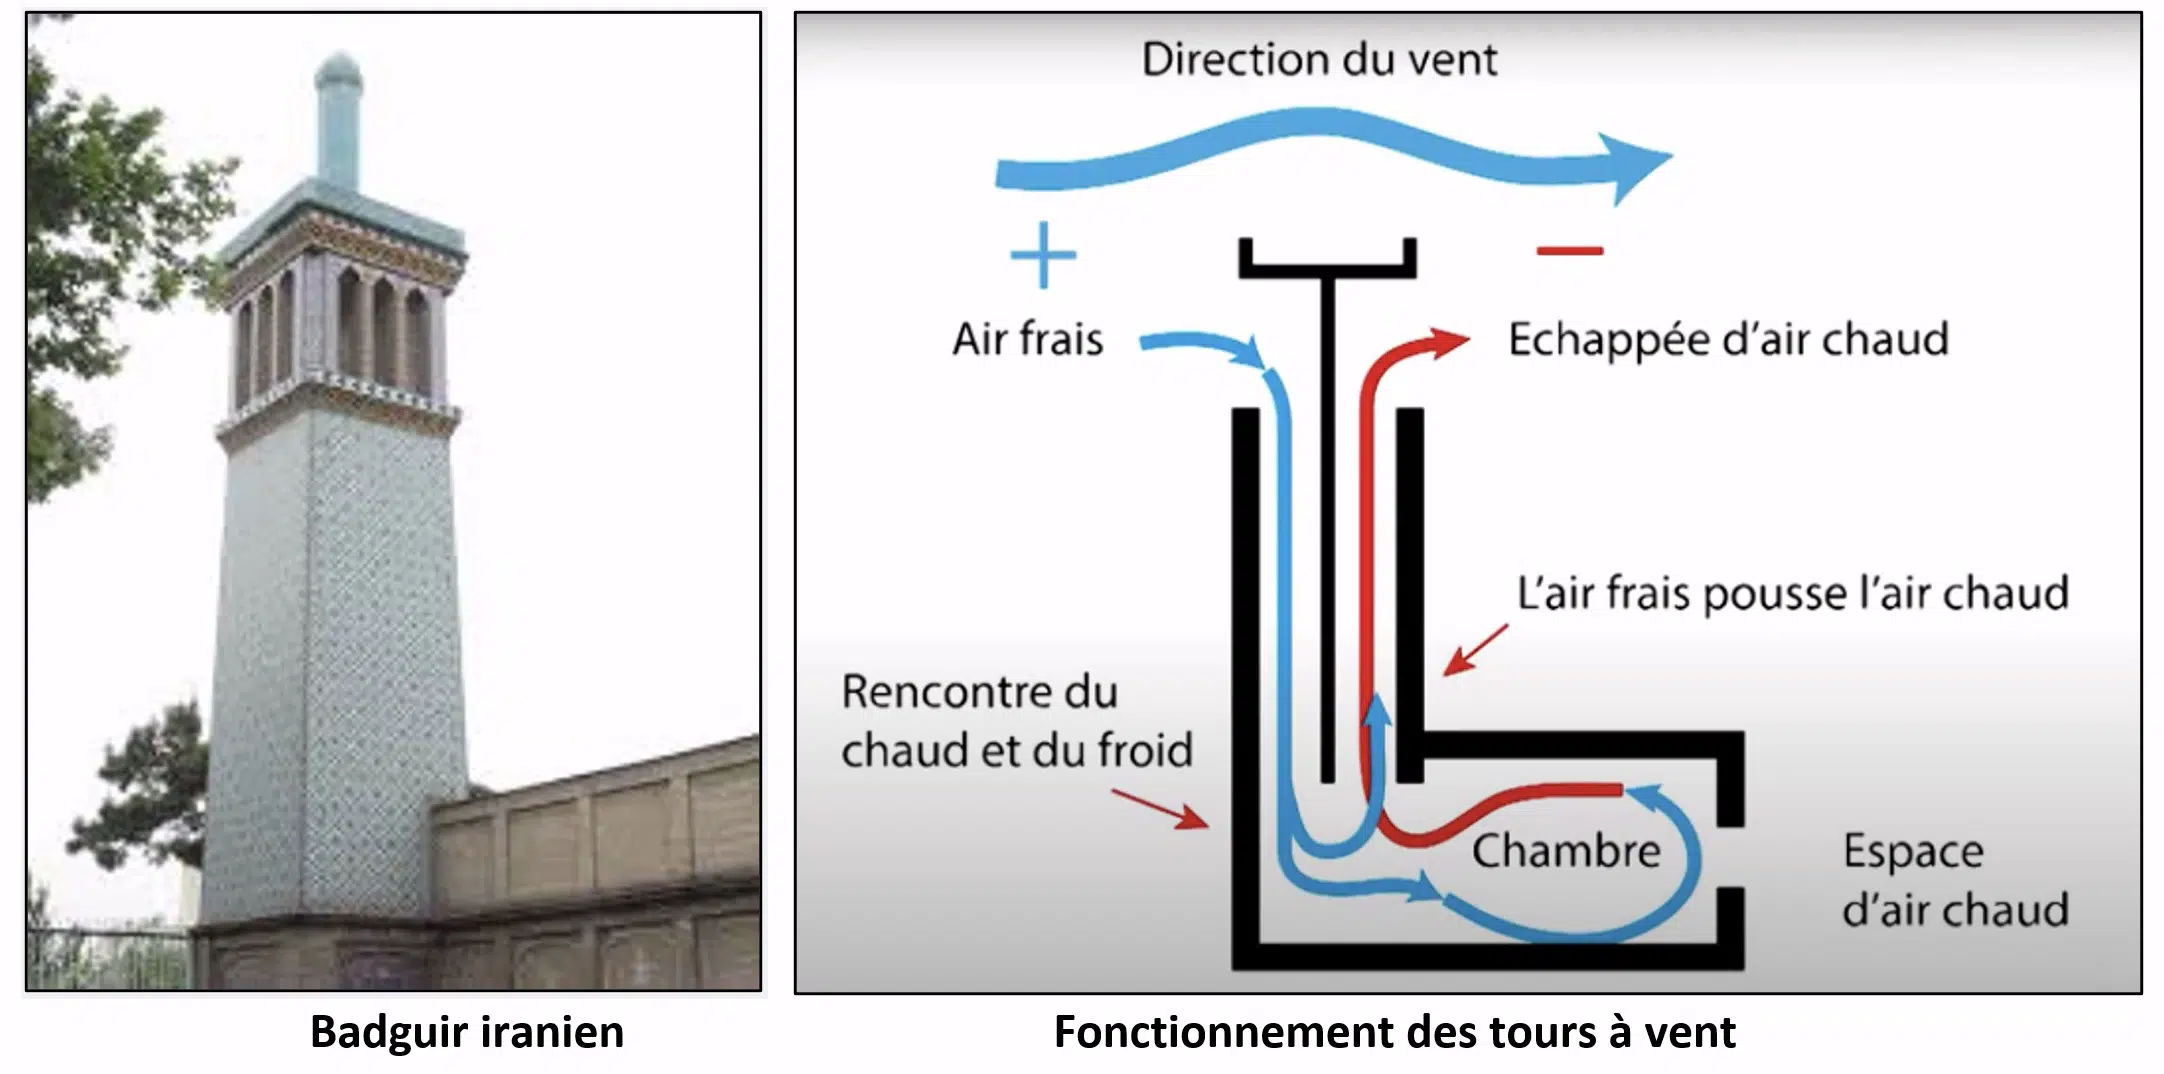
- The pressure difference between faces is what drives the air.
Comfort & safety
- Wind gusts, local tear-off, behaviour of blinds.
Dynamic pressure: the energy of the wind
The whole study starts from one reference quantity: the dynamic pressure, which measures the kinetic energy of the wind per unit volume.
Wind speed is not uniform: it increases with height following an atmospheric boundary-layer profile that depends on the site roughness (city, countryside, sea). This is why pressures rise sharply towards the top of towers.
The pressure coefficient (Cp)
The pressure coefficient Cp is a dimensionless number relating the local pressure on a surface to the reference dynamic pressure. A positive Cp indicates an overpressure (the surface is pushed); a negative Cp a suction (the surface is sucked outward).
The Cp depends on the geometry of the structure, the wind direction and the surroundings (neighbouring buildings, terrain). That is precisely what we set out to determine, whether through code charts or simulation.
Overpressure windward, suction everywhere else
The typical pressure distribution around a box-shaped building exposed to the wind:
Windward face
- Overpressure (Cp > 0): the air is slowed and "crushes" against the façade.
- Maximum near the stagnation point, in the upper part.
Sides, roof & leeward face
- Suction (Cp < 0): the air accelerates and separates, creating suction.
- Suction peaks at roof edges and corners.
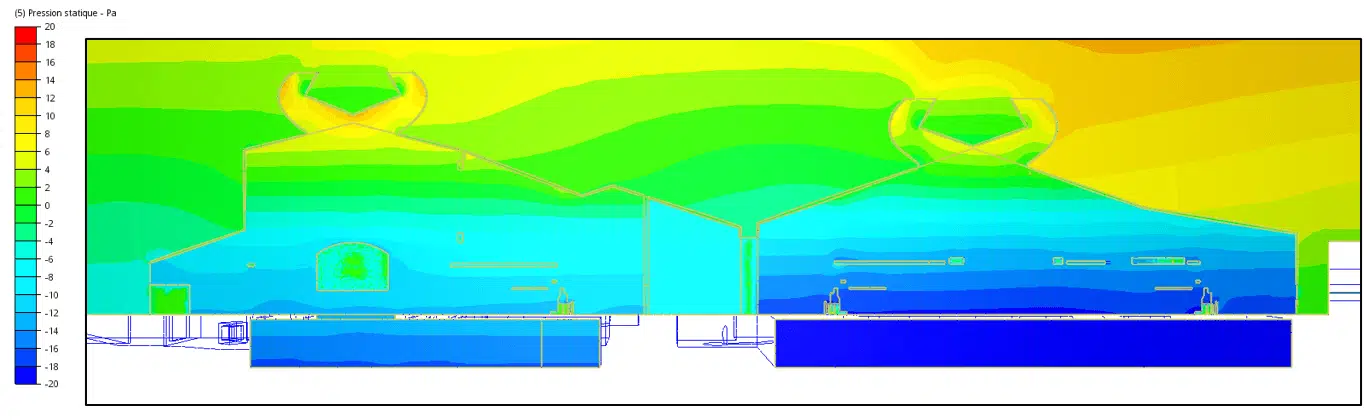
It is suction that tears things off
Contrary to intuition, roof failures rarely come from the wind "pushing" but from the suction peaks at edges and corners: the envelope is sucked outward. These highly concentrated local suctions are the hardest to estimate.
From net pressure to project decisions
What actually drives the sizing is the net pressure: the difference between the outside pressure and the inside pressure of a space. Depending on the need, the pressure field serves to:
Size the envelope
- Wind loads on façades, glazing, sun-shades and roofs.
- Verification of fixings and attached elements.
Feed natural ventilation
- The ΔP between inlets and outlets sets the cross-flow air rate.
- Optimal opening positions for the prevailing winds.
The same pressure field therefore feeds both the structural engineering office and the bioclimatic design of the building.
Eurocode 1 or CFD simulation?
Eurocode 1 (EN 1991-1-4) provides tabulated pressure coefficients for common, regular shapes. It is the regulatory reference — effective as long as the building stays within the scope of the charts.
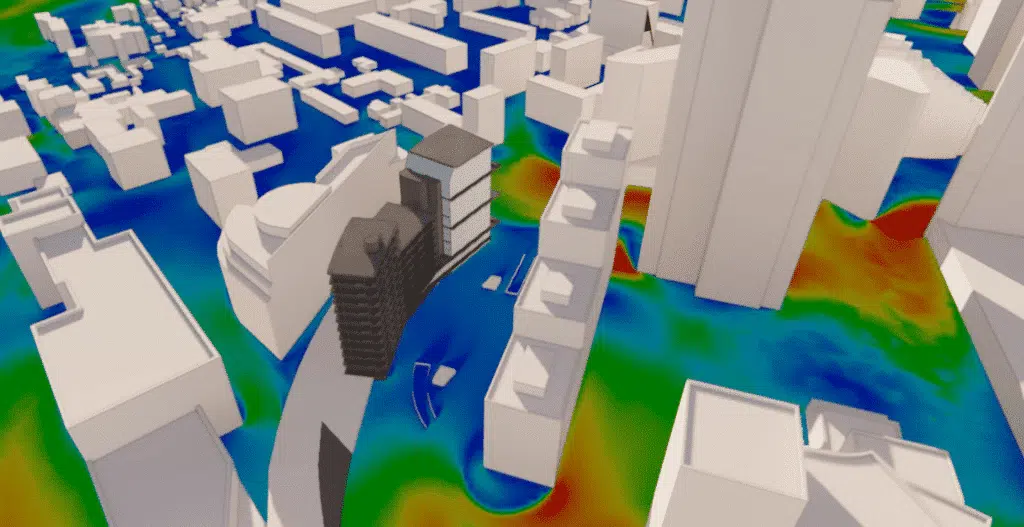
But as soon as the geometry becomes singular (complex shapes, high-rises, dense urban surroundings, non-standard roofs), the charts reach their limits. CFD simulation then computes the real Cp field, for every wind direction, accounting for neighbouring buildings.
Eurocode 1
- Fast, regulatory, suited to simple shapes.
- Conservative and limited beyond the tabulated cases.
CFD simulation
- Real geometry and surroundings, all wind directions.
- Essential for non-standard structures.
Pressure plots from CFD
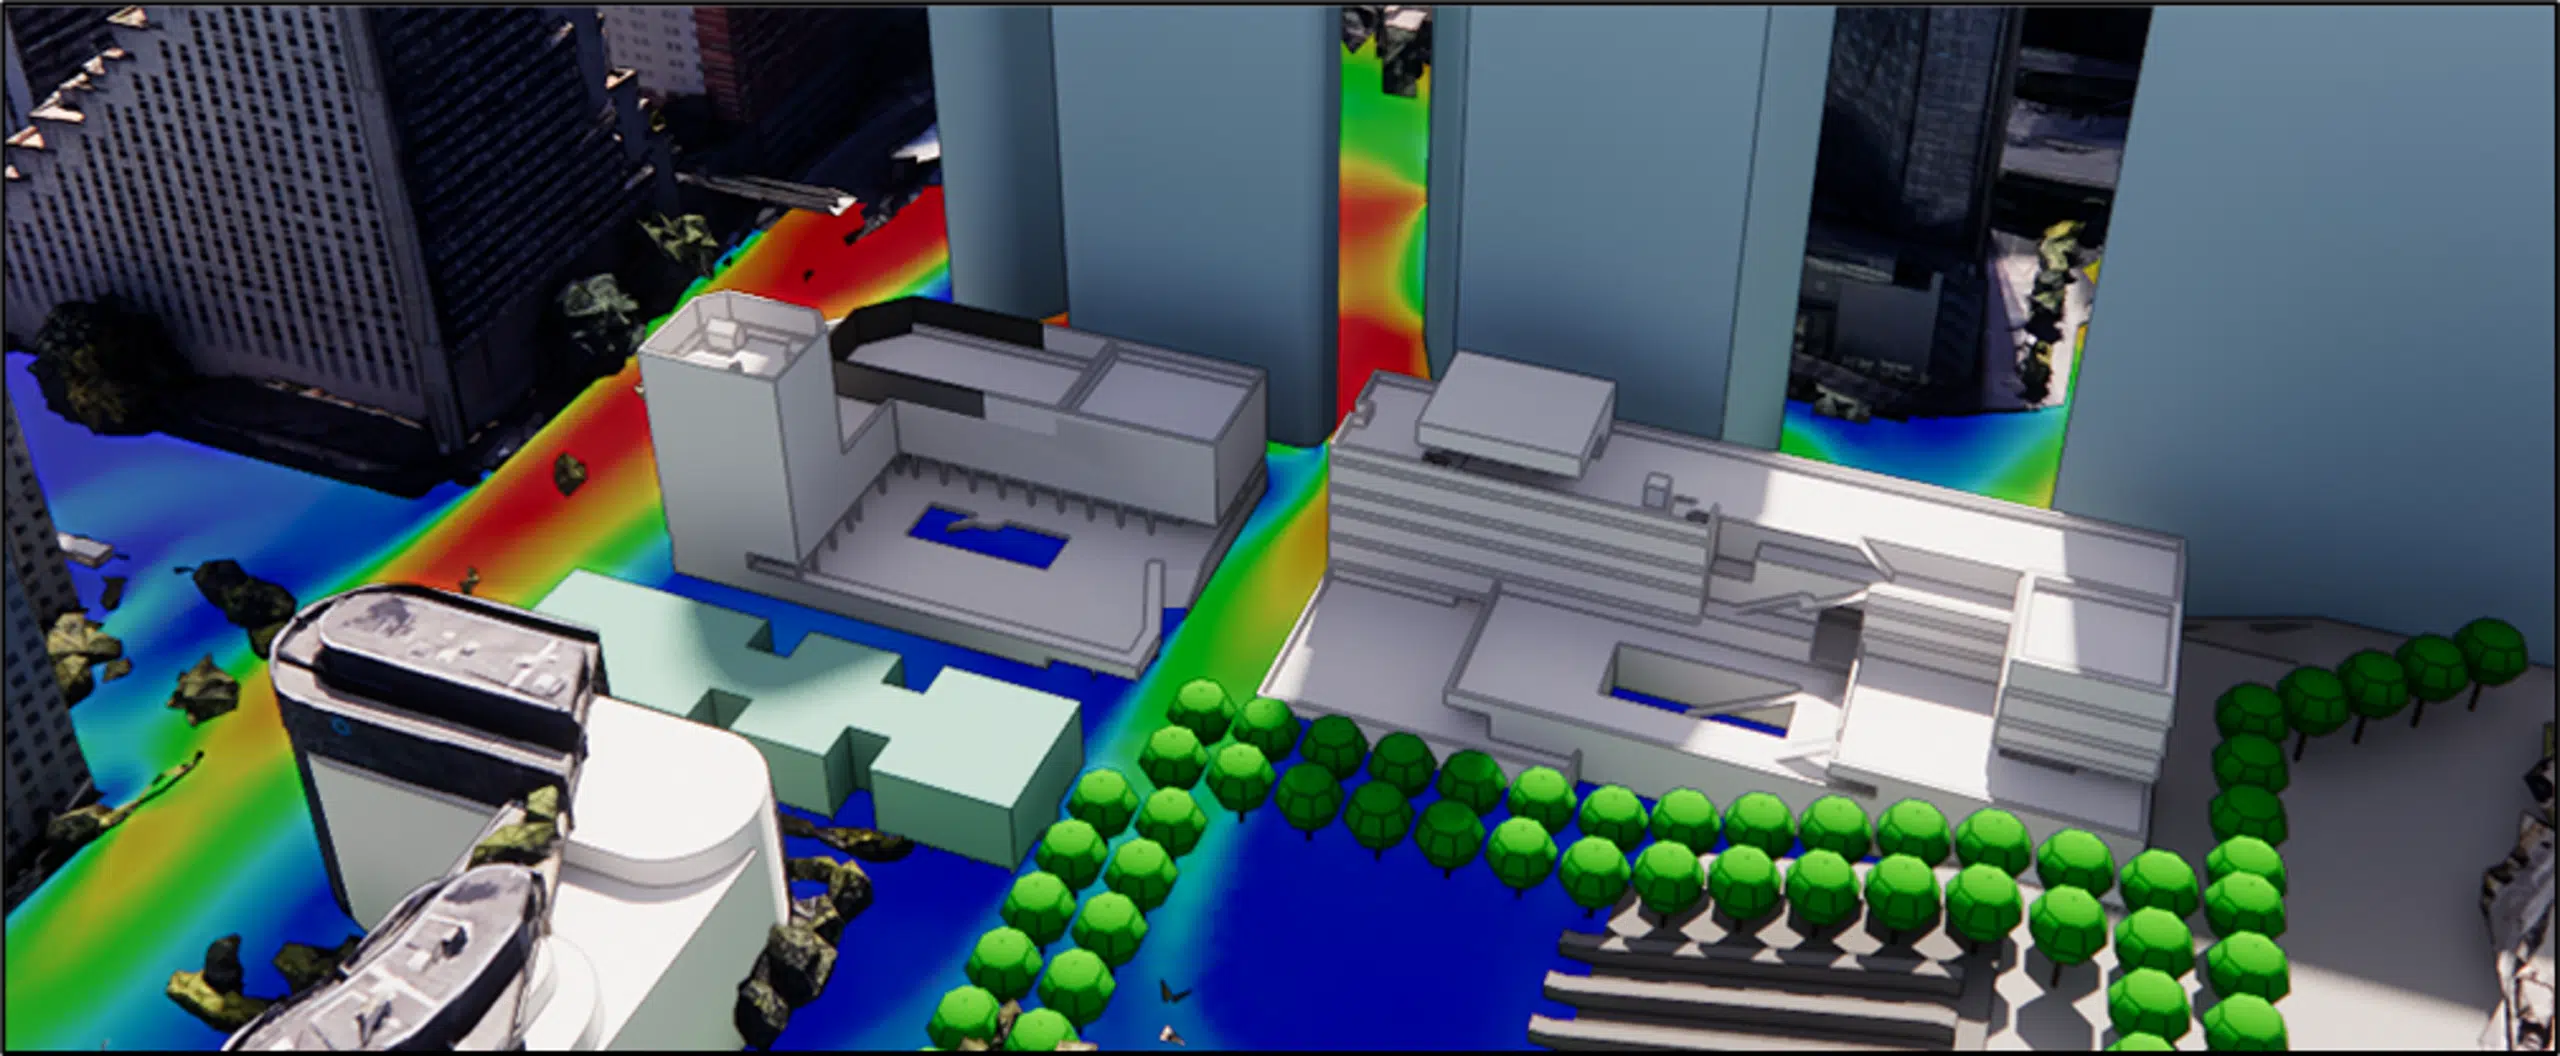
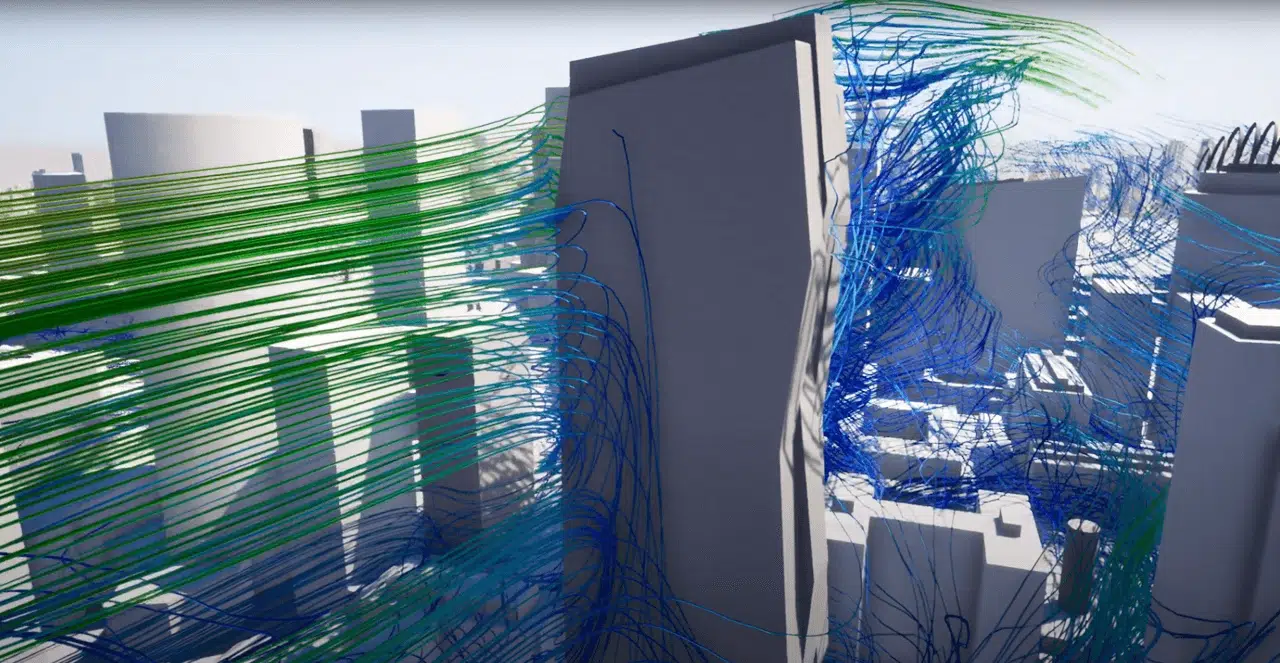
CFD simulation delivers a continuous pressure plot over the whole envelope: every square metre gets its Cp, for every wind sector. The suction peaks are pinpointed, the ventilation drivers quantified, and the effect of changes (canopies, wind-breaks, layout) tested before construction.
Our engineers build the pressure plots of your building by CFD, for every wind direction. Let's talk.