CFD modelling of the aerodynamic interactions within a group of riders
The performance of cyclists in a peloton is largely influenced by the fluid dynamics that develop around them.
In a race, cyclists form compact groups to take advantage of the drafting effect and reduce air resistance, which can significantly improve their energy efficiency and their overall performance. This effect is particularly crucial in top-level competition, where the slightest energy saving can make the difference between victory and defeat.
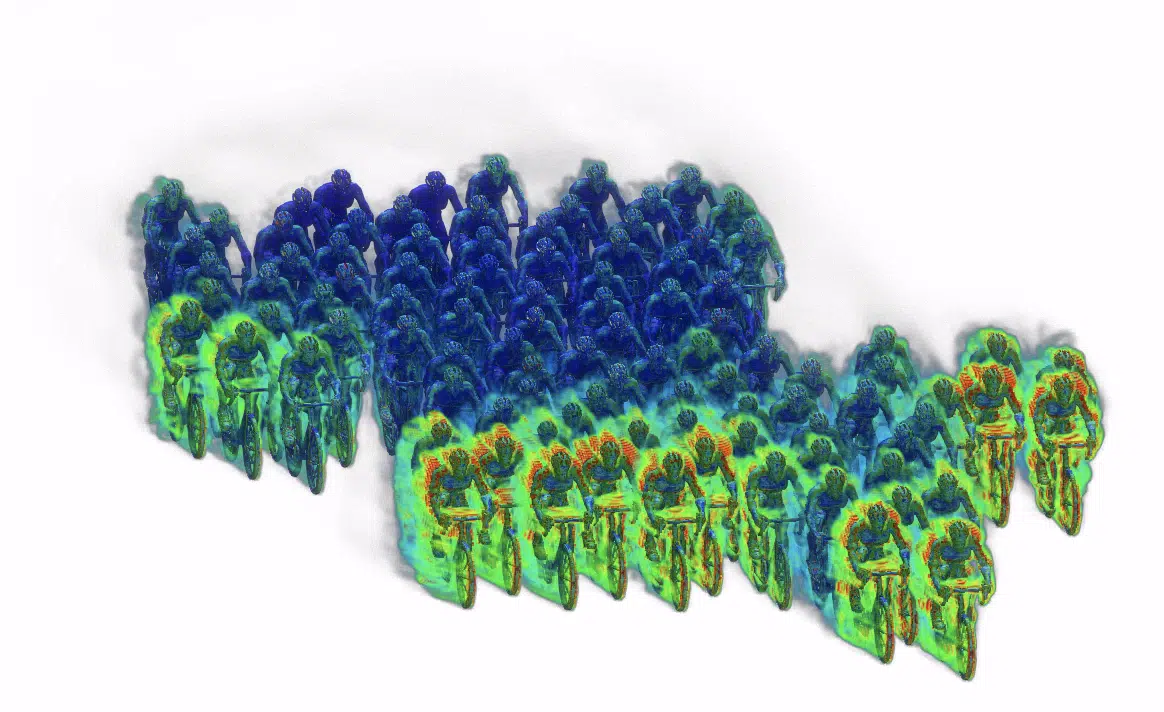
Understanding the fluid dynamics around a cycling peloton has major practical implications. The peloton formations and the relative positions of the cyclists directly influence the distribution of aerodynamic drag, thereby affecting individual energy expenditure. For example, the cyclists at the front of the peloton generally face greater air resistance, while those behind benefit from a significant reduction in this drag.
By optimising the peloton formations and exploiting race strategies based on fluid dynamics, teams can maximise collective efficiency. This is particularly relevant in stage races, team time trials and criterium races, where energy management is essential to maintain high performance over long distances.
However, despite its importance, the fluid dynamics around pelotons are complex and difficult to study empirically because of the many variables at play: the speed, the wind direction, the position of the cyclists and the aerodynamic interactions.
This is where CFD simulations (Computational Fluid Dynamics) become a valuable tool. They make it possible to model and analyse these phenomena with greater accuracy and flexibility, without the logistical constraints and costs of wind-tunnel or field testing.
The aim of this study is to use CFD simulations to deepen our understanding of the fluid dynamics within a peloton. By analysing different configurations and positions of the cyclists, we aim to identify the optimal formations to minimise aerodynamic drag and maximise energy efficiency.
CFD simulation methodology for analysing a peloton
CFD simulation
CFD (Computational Fluid Dynamics) is a numerical method for analysing fluid motion by solving partial differential equations. It models airflow in a precise and detailed way and quantifies the aerodynamic forces exerted on each body.
To study the fluid dynamics around a cycling peloton, we used CFD simulation, a powerful technique for modelling airflow. It offers the advantage of being able to easily explore various configurations and to quantify the aerodynamic forces exerted on each cyclist individually. By comparing these forces, we can identify the positions and the most effective formations in terms of drag reduction.
CFD simulation is a powerful method, but its limits in terms of computation time and computing resources can be constraining: here, a maximum of one week of computation and the absence of a data center. To overcome these limitations, compromises such as optimising the simulation parameters, like using an adaptive mesh, were necessary to strike the balance between accuracy and efficiency.
Parameters of the CFD studies
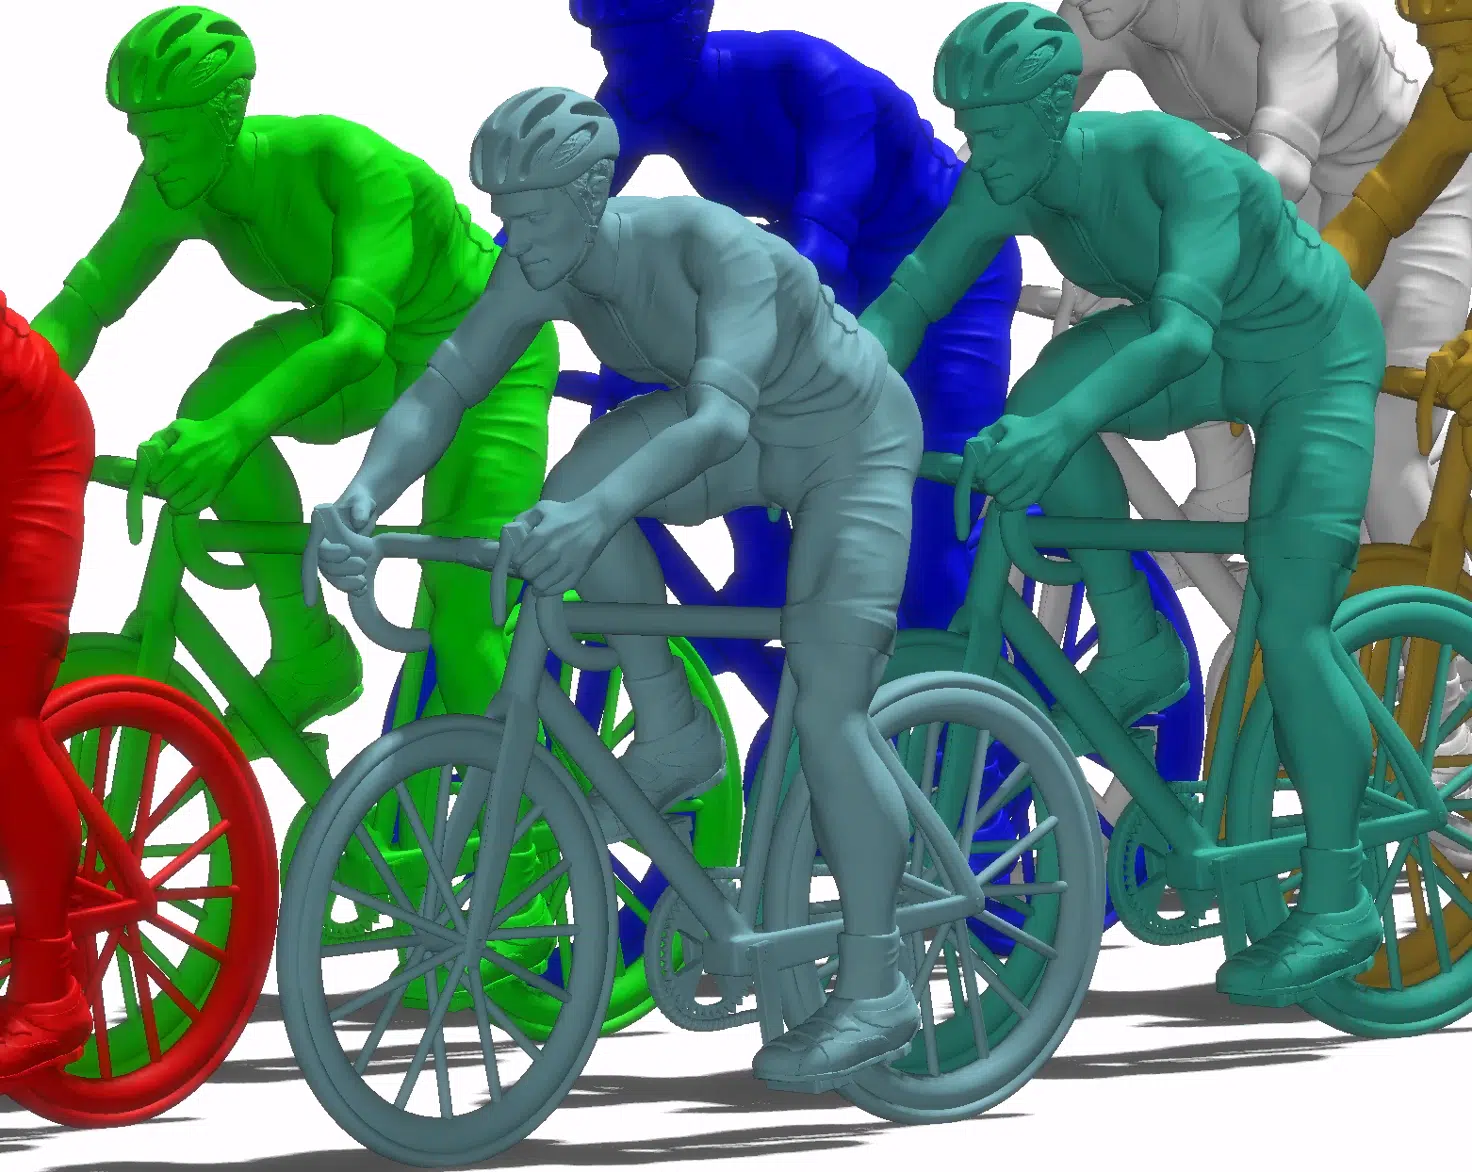
To ensure an accurate comparison of the aerodynamic forces inside and outside the peloton, we standardised the geometry of each cyclist. By using identical models, we eliminated the variables linked to individual differences and focused the analysis on the impact of the positions and formations within the peloton.
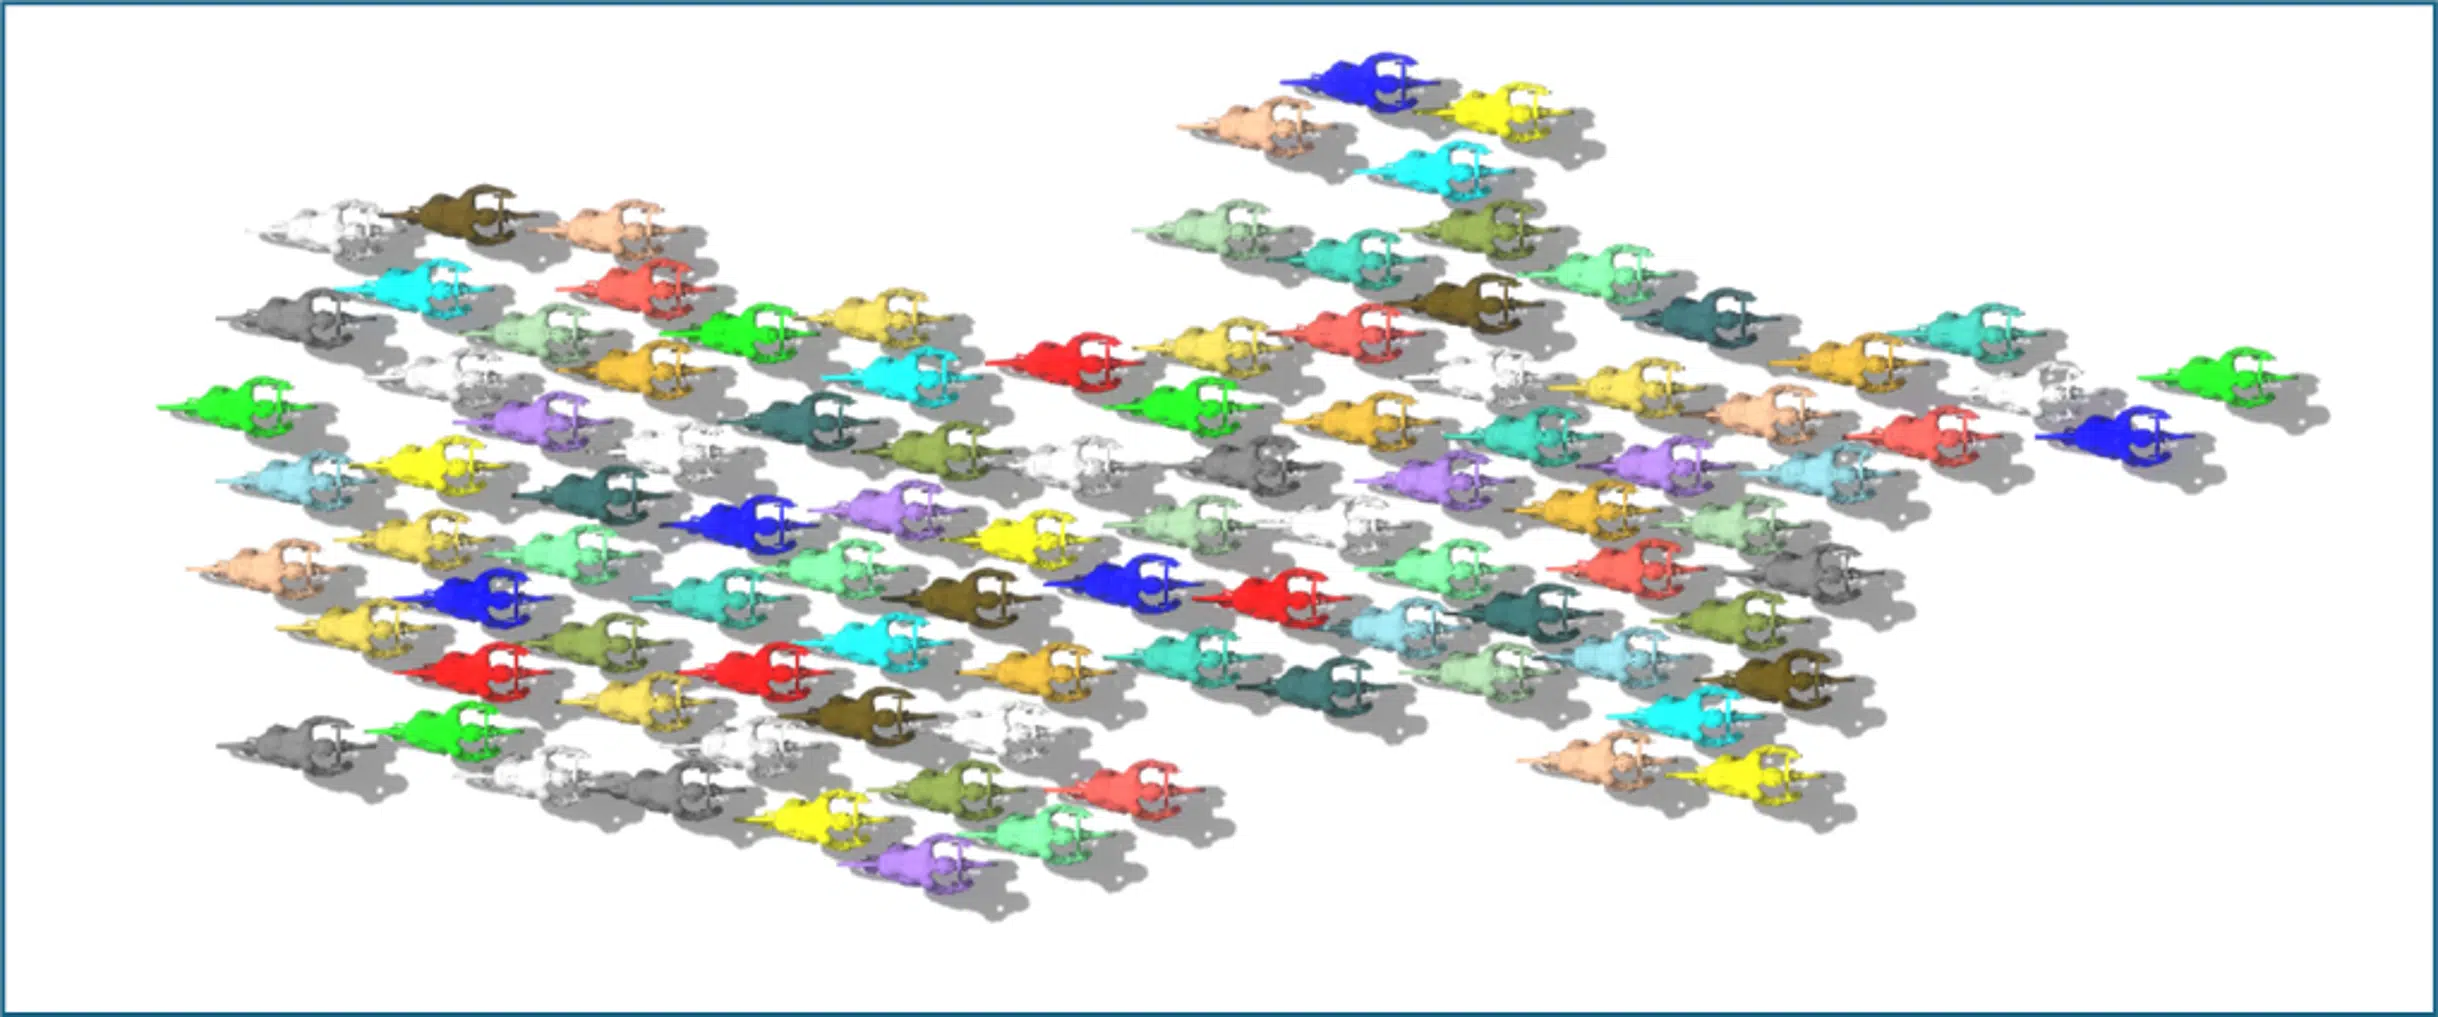
This geometric uniformity ensures that the variations observed in the aerodynamic forces are due solely to the interactions between the cyclists and their relative arrangement, giving more reliable and relevant results.
To carry out the simulation, a high-fidelity model was used: the Wall-Modeled Large Eddy Simulation (WMLES). This model captures the details of the turbulent flows by automatically adapting the resolution near the walls, while accounting for the pressure gradients responsible for flow separation. WMLES uses a viscosity model called Wall-Adapting Local Eddy (WALE), which ensures consistent local viscosity and accurate behaviour near the walls, and makes it possible to dynamically refine the wake as the flow develops.
A realistic, not grid-like, layout
Several research efforts, such as The Peloton Project by Professor Bert Blocken (Eindhoven University of Technology), have examined the fluid dynamics of a peloton. But they often neglect the non-uniform nature of the riders' layout: they are not arranged in a regular grid. It is therefore necessary to study a more realistic configuration.
The configuration studied is that of a peloton of 100 cyclists arranged so as to simulate a real race on a wide road. This approach makes it possible to analyse the variations of the aerodynamic forces under near-real conditions, unlike rigid, aligned formations that are less representative of race dynamics.
Measuring the drag forces
Stakes
Measuring the drag forces is crucial in cycling: it makes it possible to quantify the air resistance that each cyclist must overcome. This aerodynamic resistance is one of the main factors limiting performance, especially at high speeds. Reducing drag means a significant energy saving, making it possible to maintain higher speeds with less effort.
Aerodynamic drag: how does the air affect performance?
Aerodynamic drag, or air resistance, comes from the interaction between the cyclist (and the bike) and the moving air. It depends on the density of the surrounding air, the cyclist's speed, the exposed frontal area and the drag coefficient (Cd or Cx) which reflects the overall aerodynamics of the cyclist-bike configuration.
Drag is proportional to the product of the air density by the square of the speed and by the frontal area. The cyclist must literally “push” all the air volume they pass through: reducing the air density or the frontal area therefore significantly lowers this drag.
A cyclist who wants to reduce their drag can lower their frontal area by adopting a more crouched position, a common strategy in time trials. The drag coefficient depends not only on the aerodynamic shape, but also on the details of the airflow around the rider.
Research shows that the cyclist's motion creates an overpressure of air in front and a low pressure behind, both contributing to drag. In addition, the cyclist drags air along over several metres in their wake, complicating the interactions for the riders downstream.
For cyclists in a peloton, the drag effect is modulated by their relative position. With a headwind, riding in single file reduces the drag of the following riders thanks to the reduction in overpressures and low pressures; the effect is more pronounced for the cyclists behind and depends on the distance between the wheels and the aerodynamic position adopted.
Distribution of speeds and pressure by CFD simulation
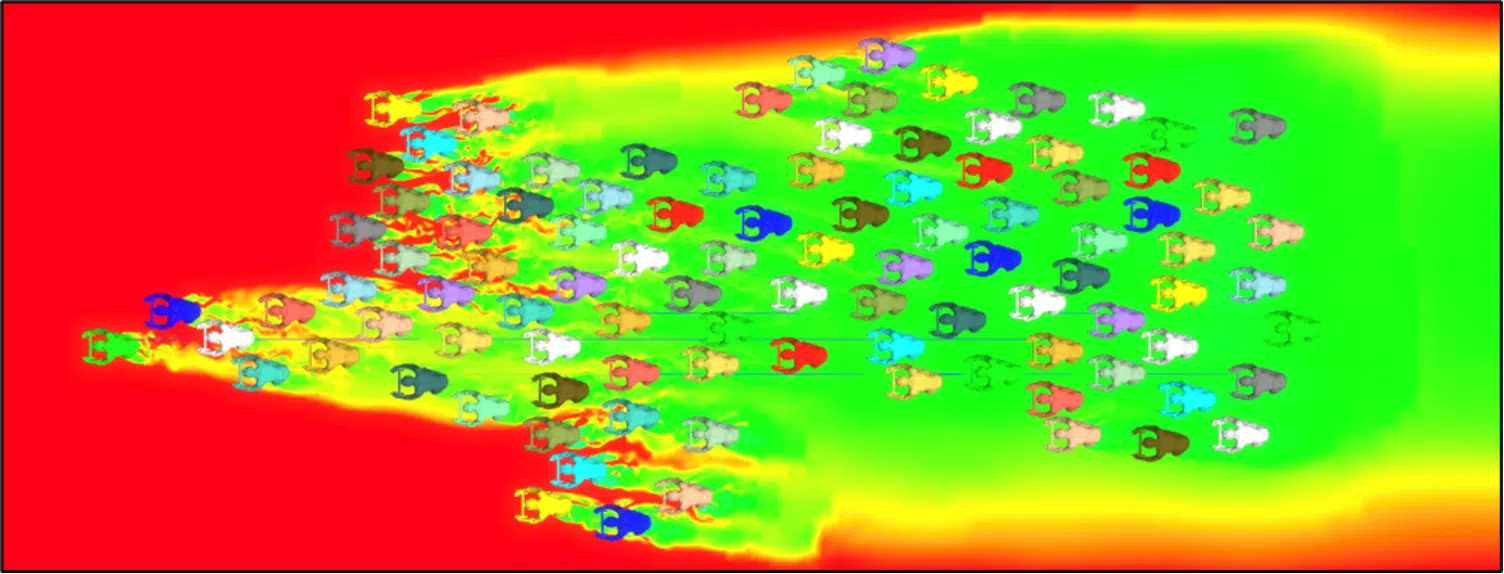
The simulation makes it possible to display the velocity distribution planes around the cyclists. Since the drag force is proportional to the square of the speed, the most favourable zones of the peloton can already be spotted.
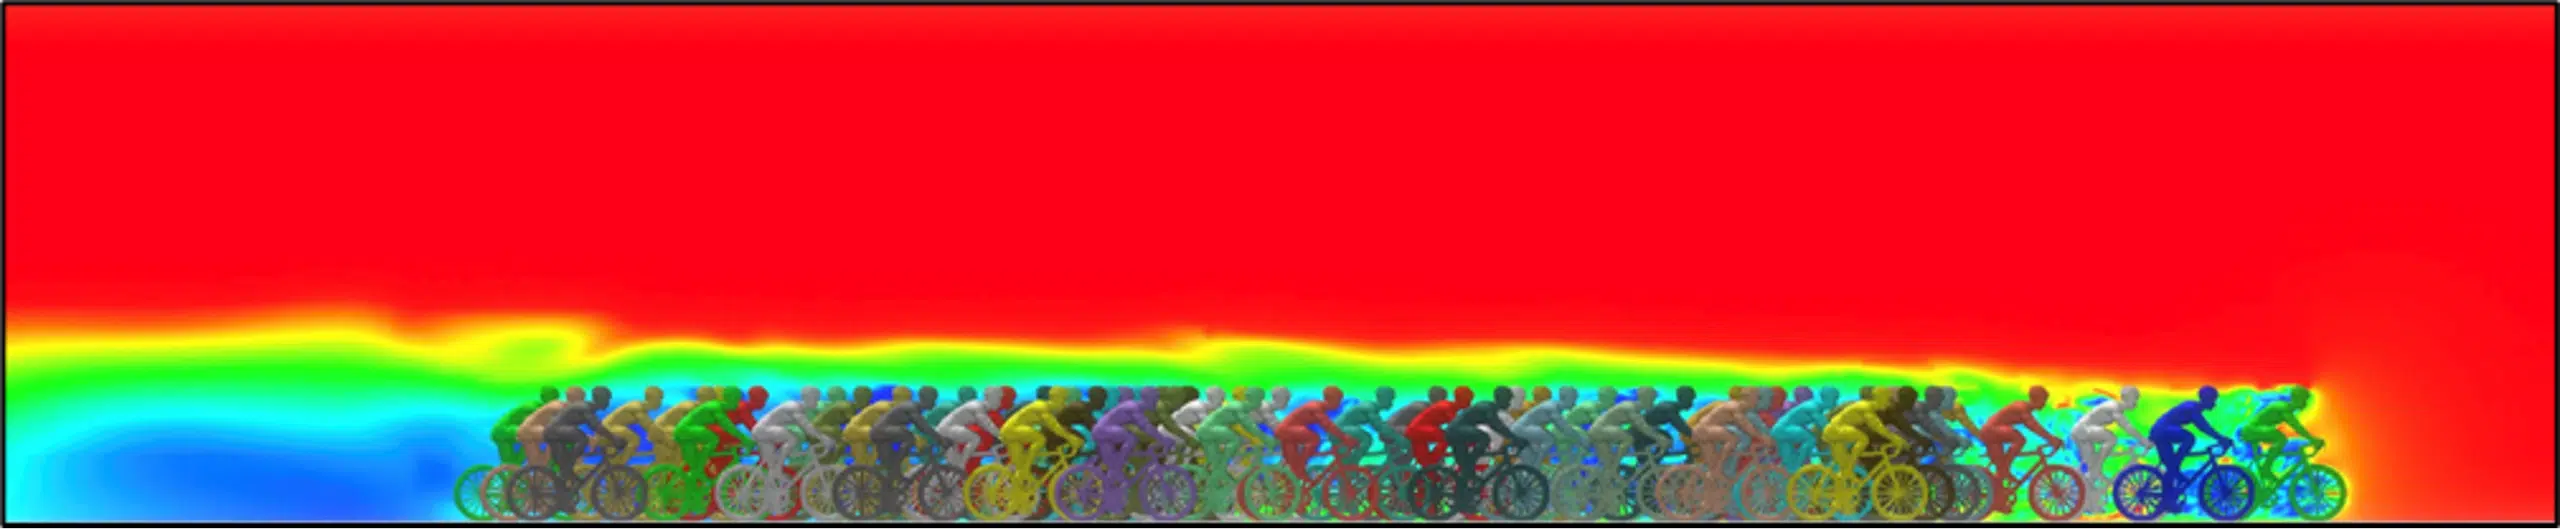
The apparent air speed is 15 m/s (i.e. 54 km/h) for the cyclist at the front of the peloton: they therefore feel more drag than the riders within the peloton, where the effective speeds are lower. The two figures below show this from above.
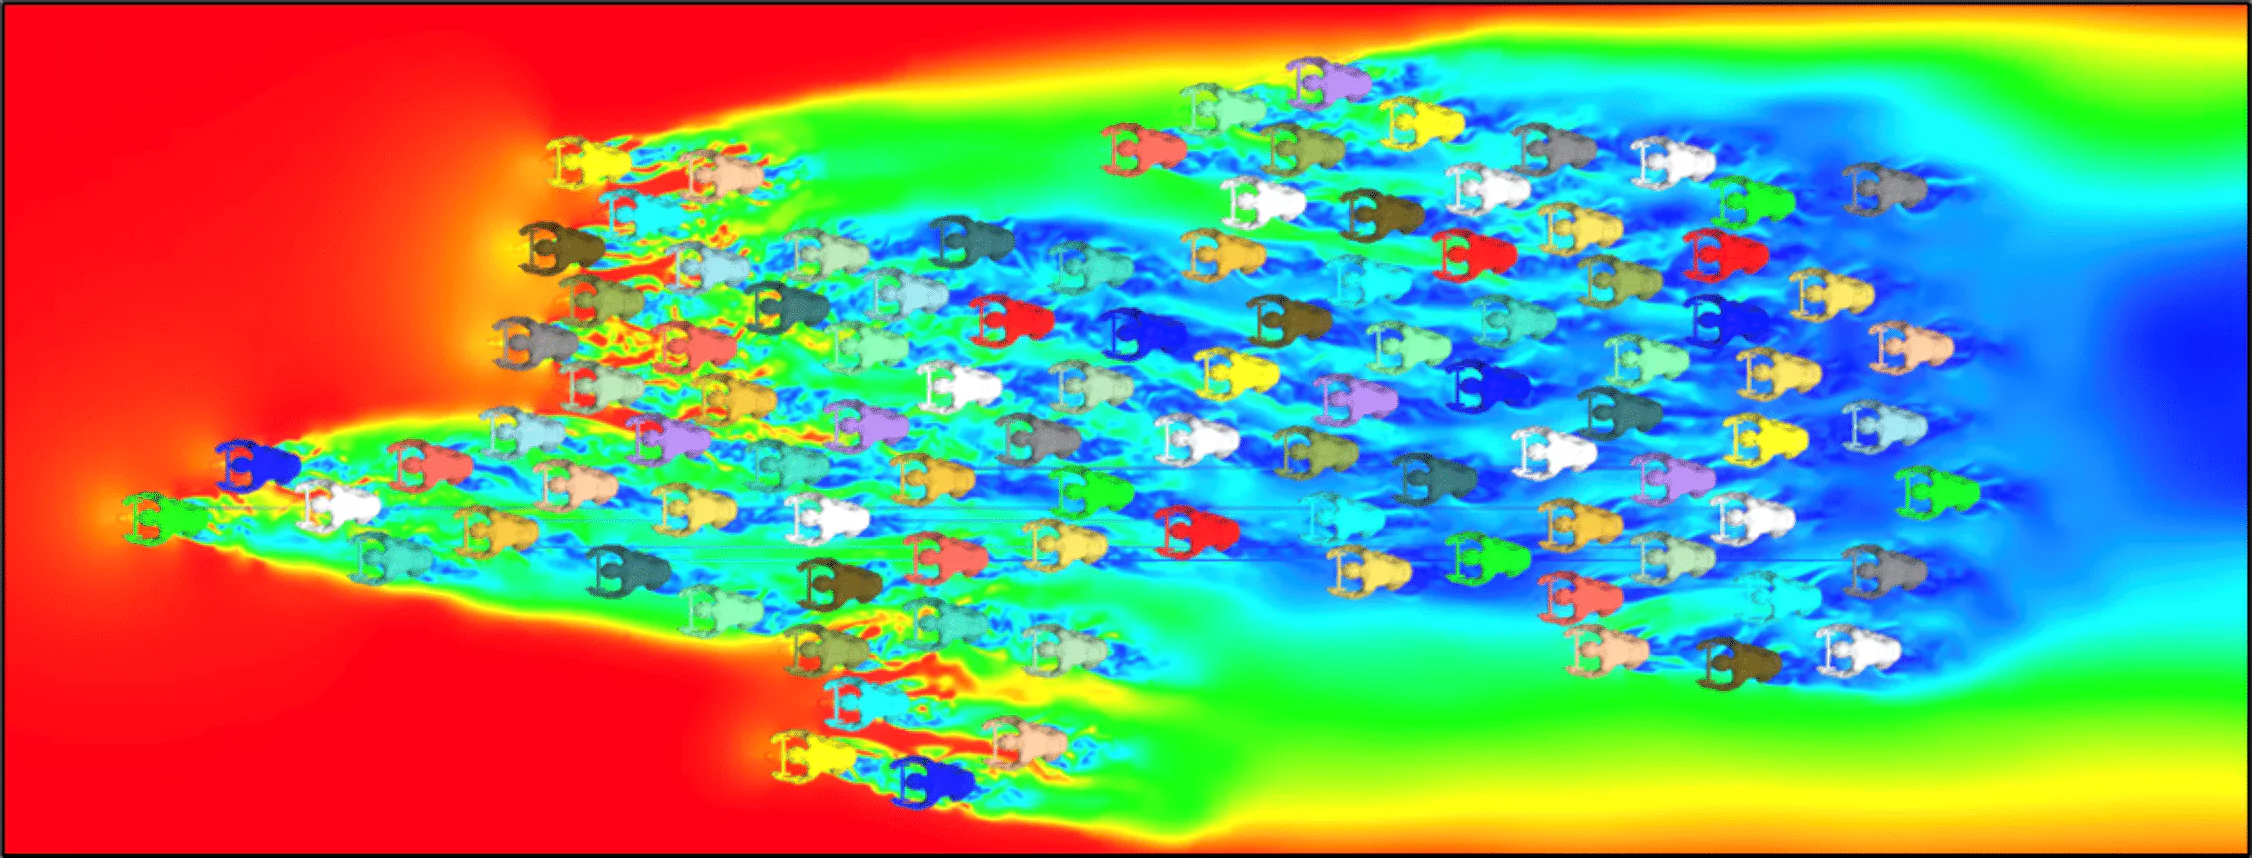
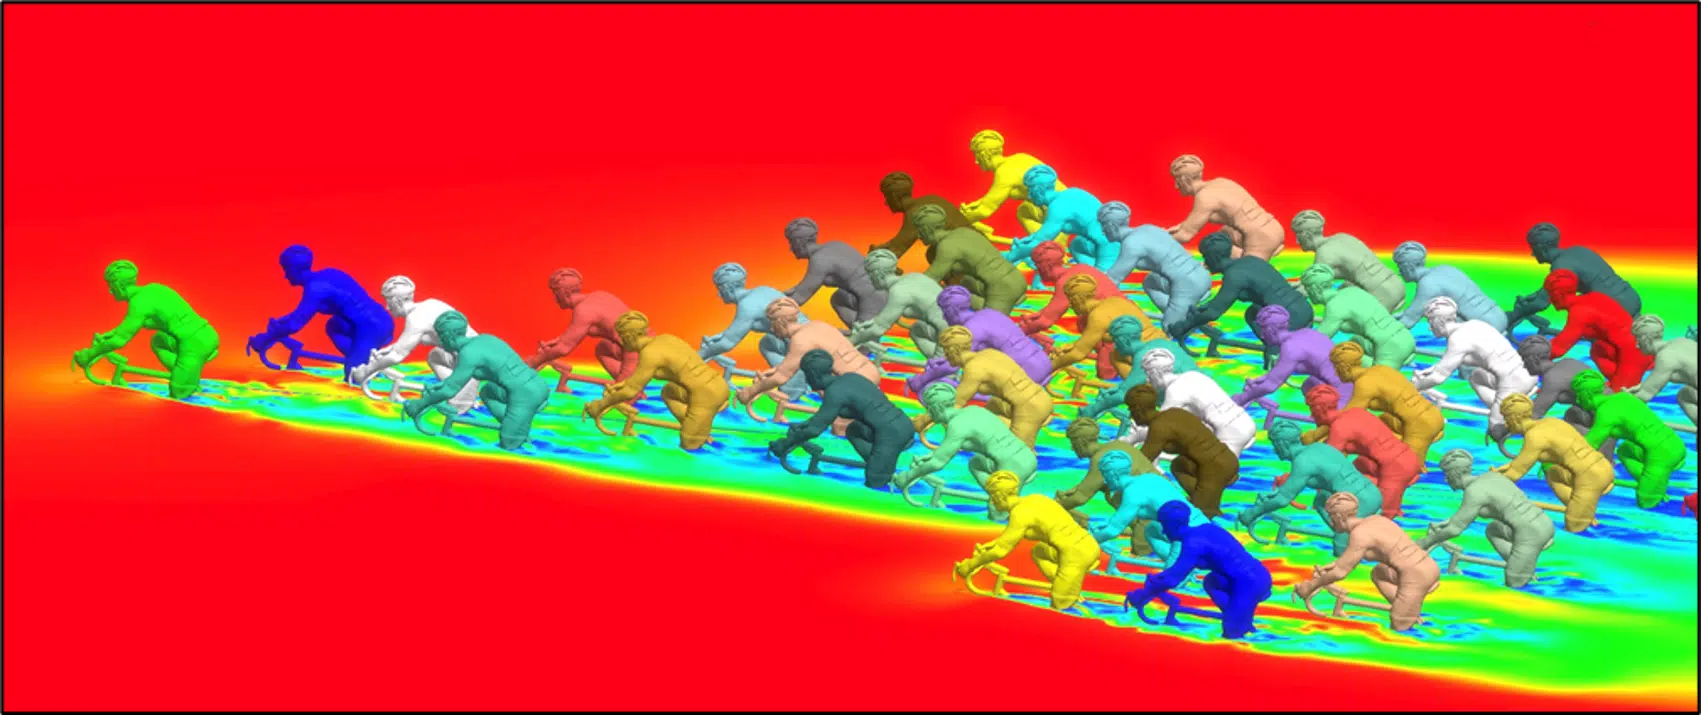
The cyclists at the front encounter higher air speeds, while the riders further back and inside the peloton encounter lower speeds. The front riders act as a windbreak, protecting those behind. Since the drag force is proportional to the square of the speed, the drag on the front riders is far greater than that felt at the back of the peloton.
It is also said that the riders in the heart of the peloton benefit from the drafting generated by those at the front. By tucking into their wake, they take advantage of the low pressure behind them, which reduces the overpressure they create and therefore their drag. This drafting effect allows them to maintain high speeds with less effort.
In practice, CFD makes it possible to optimise the cyclists' position, choose more aerodynamic equipment and develop race strategies. In time trials, riders adjust their position to maximise aerodynamics, often by adopting a lower, more stretched posture to minimise the frontal area. They use bikes with profiled frames and solid wheels, and test aerodynamic helmets and skinsuits in the wind tunnel.
CFD has an advantage over wind-tunnel testing: a saving of time and money. Thanks to these adjustments based on simulation data, cyclists gain precious seconds; teams also form strategic pelotons maximising the drafting effect and reducing collective drag.
Measuring the drag on the CFD simulation
We assessed the drag forces on each cyclist and identified the most favourable positions. The map below shows the percentage of drag felt by each rider, compared with that of the front cyclist (maximum drag: 100%).
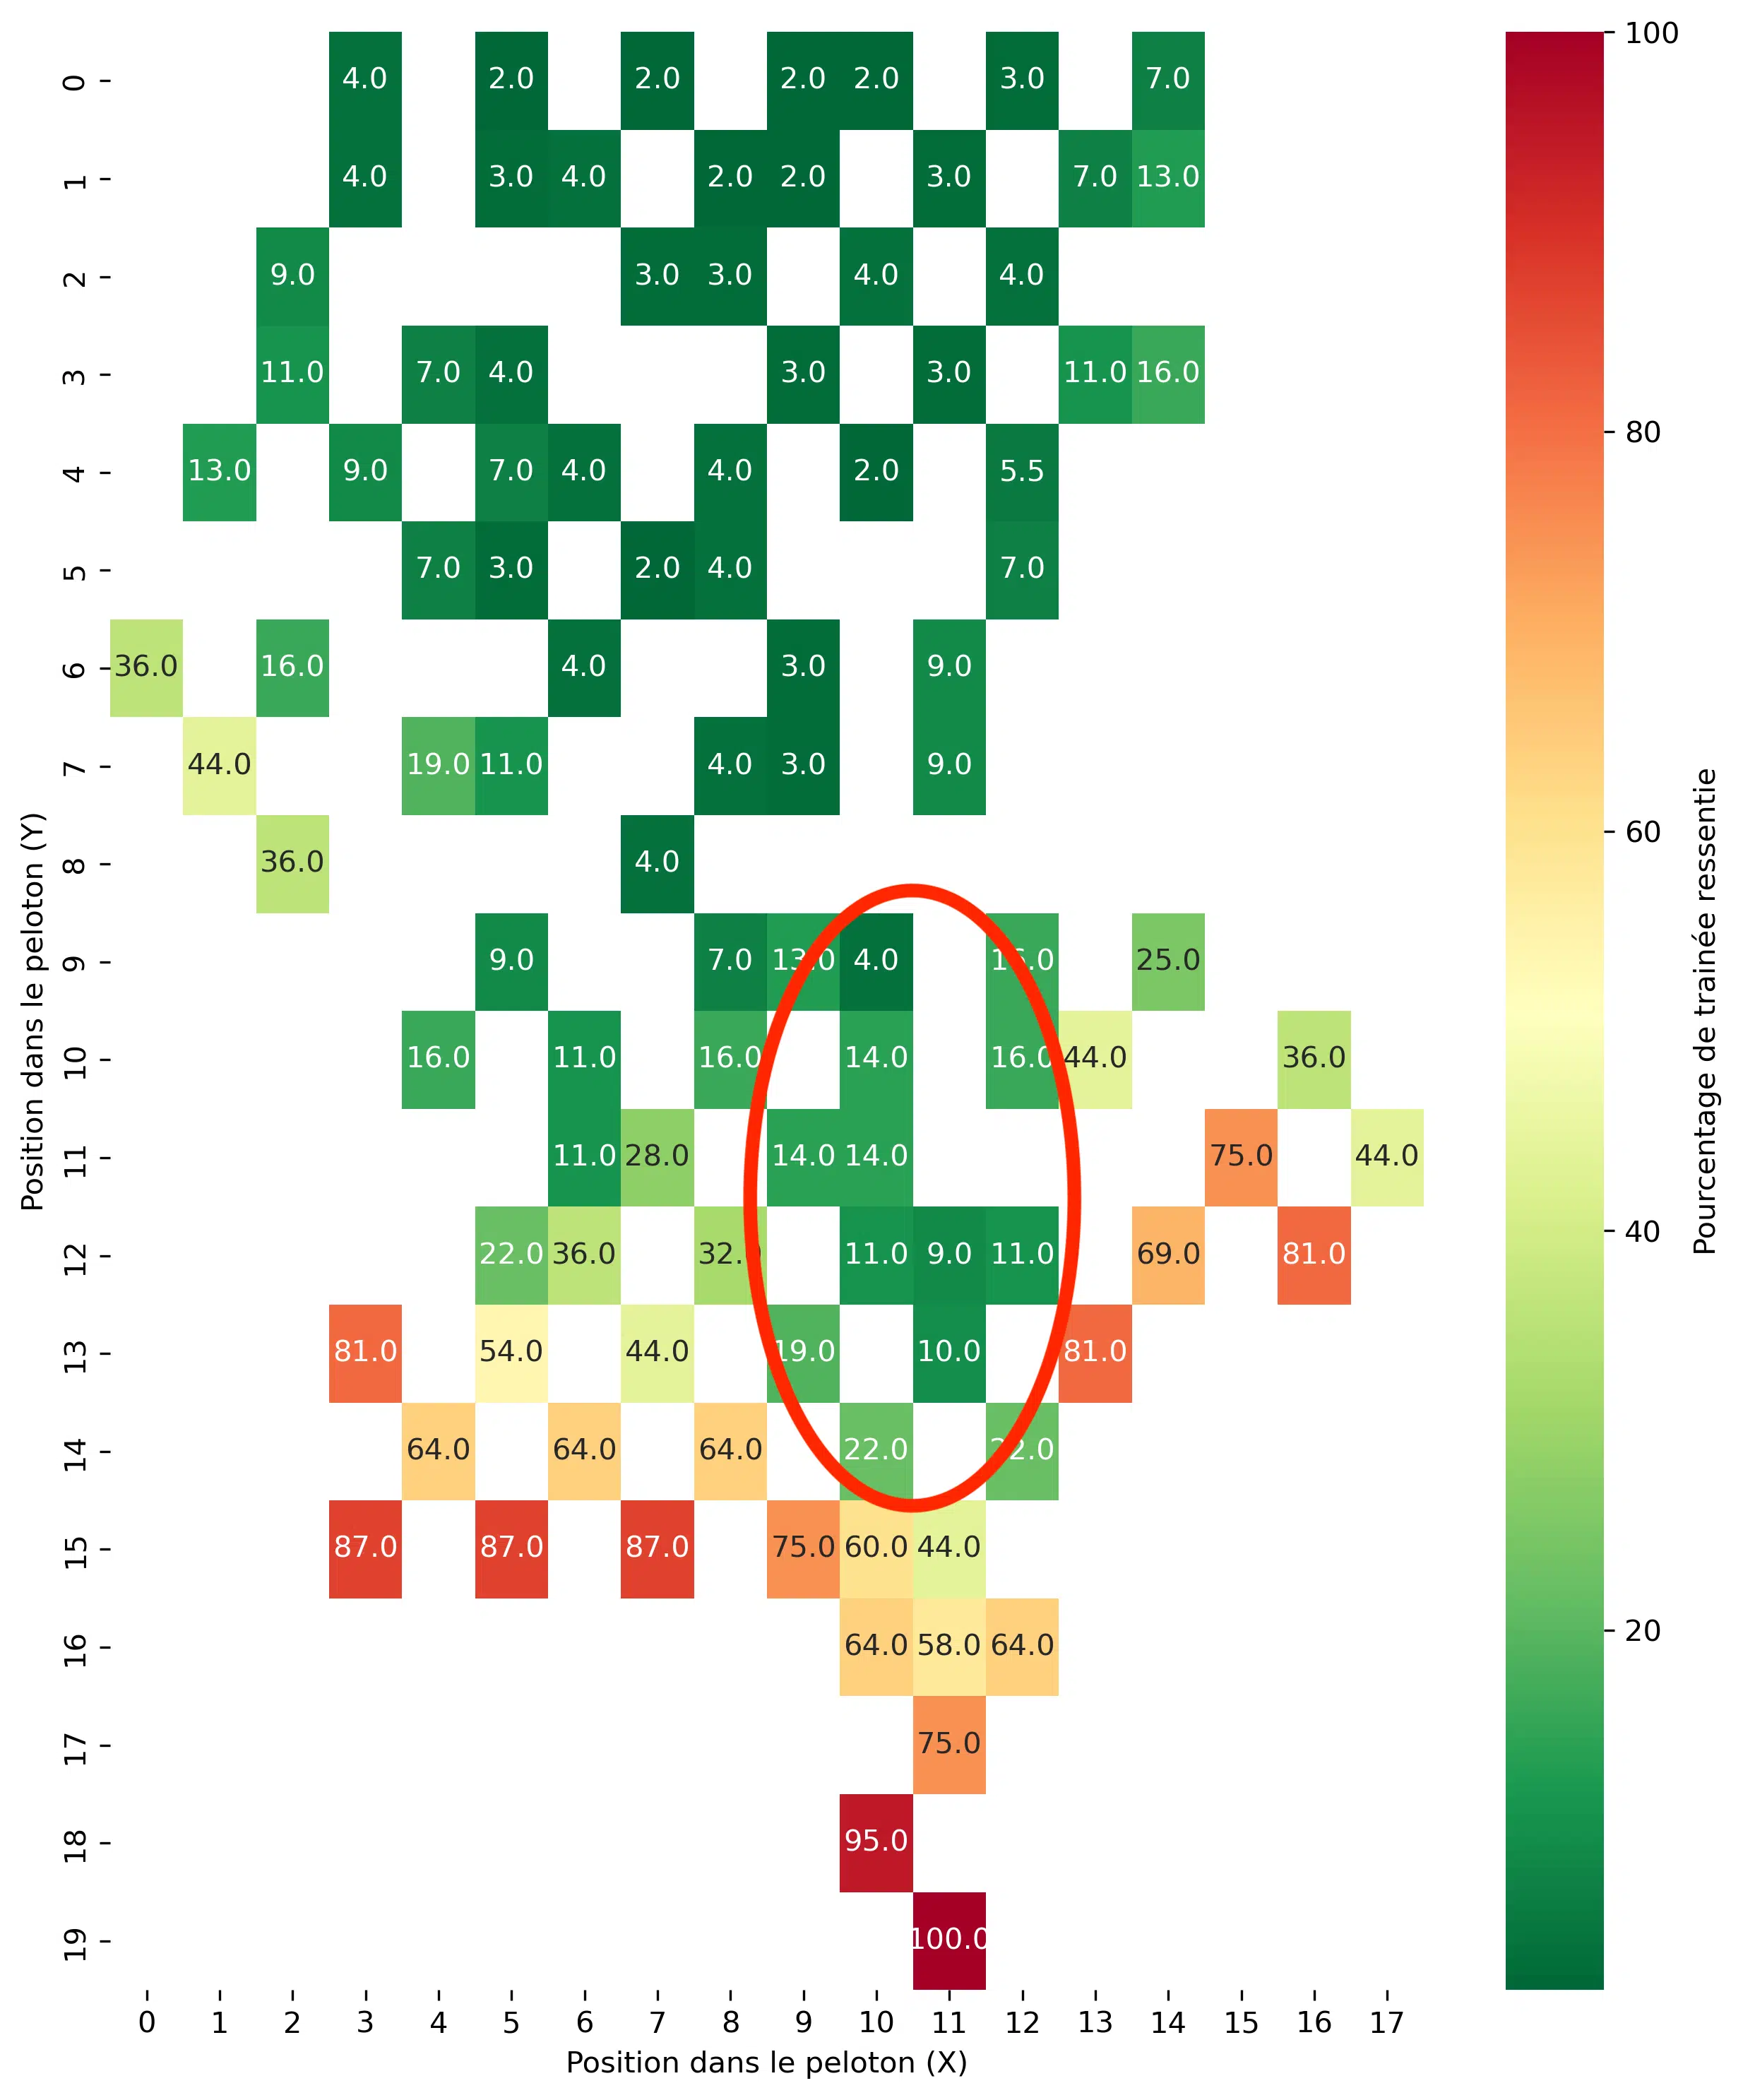
The cyclists in favourable positions inside the peloton enjoy lower drag percentages. The riders in the heart of the peloton put in half as much effort as those at the front.
The placement strategy to minimise drag
In general, all the cyclists feel less drag than the front rider. The further a cyclist is placed towards the back and the centre of the peloton, the less they are exposed. The zone outlined by the red circle is the most advantageous early in the race: there, riders feel only 10% to 20% of the leader's drag while staying close to the front, a considerable energy saving.
However, the choice of position is not based solely on energy: the further a rider is towards the back of the peloton, the more vulnerable they are to the accordion effects caused by accelerations at the front and to possible crashes. This is why the Tour de France leaders prefer to stay in the leading ranks, surrounded by their teammates, to react quickly while still enjoying a significant drag reduction.
Vorticity field
Vorticity is a measure of the rotation of a fluid around a local axis. When an object, such as a cyclist, moves through the air, it disturbs the flow: this disturbance results in the formation of vortices, zones where the speed and direction of the fluid are altered, which generate vorticity.
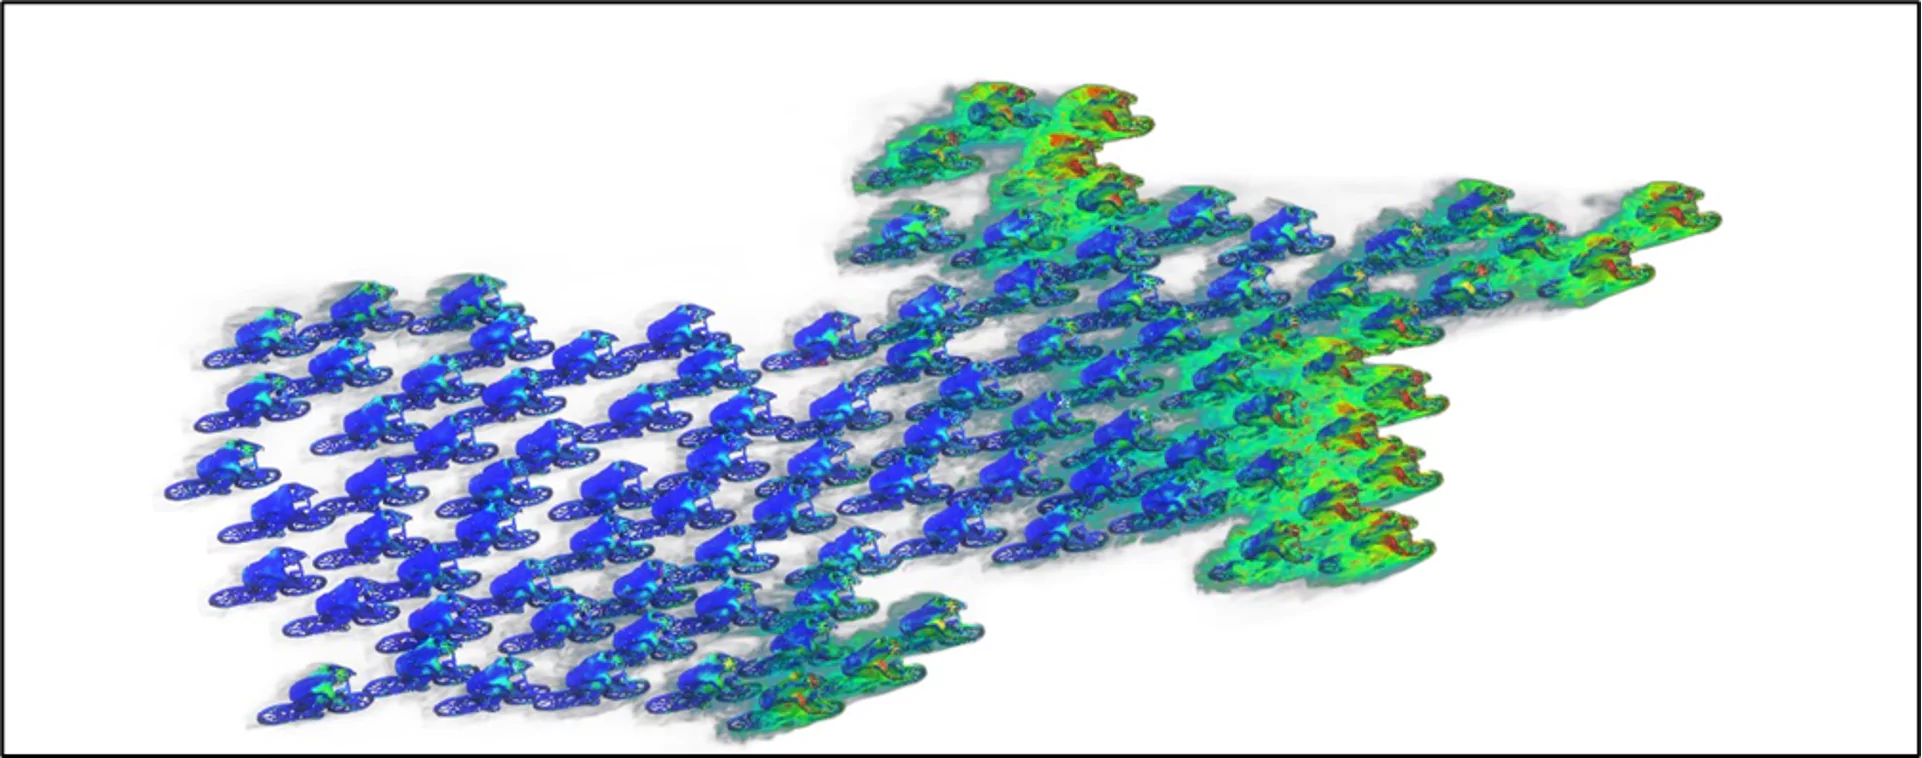
Displaying the volumetric vorticity field shows that it is the bikes at the front of the peloton that disturb the flow the most, hence a higher drag on them.
The crosswind-split phenomenon en cyclisme
Forming echelons: a collaborative strategy against the wind
To protect themselves from the crosswind, an effective strategy is to form echelons. A rider positions themselves slightly behind and to the side of the one making the effort, thereby sheltering from the wind. The stronger and more lateral the wind, the more the rider moves sideways to benefit from this protection.
When a rider finds themselves isolated and exposed to the wind, they are said to be “in the gutter” or to have been “caught out in the split”. For them, the effort becomes considerably harder, often to the point of no longer being able to follow the peloton.
The key to this strategy is to form echelons. The front rider positions themselves on the side the wind comes from to protect those behind. After their turn at the front, they ease off, letting their teammates benefit from their shelter while they drop back towards the rear of the group before taking their place again out of the wind. This process ensures a continuous rotation of turns and optimal protection.
Surviving the split: sheltering from the wind as a group
There are two types of echelon: single and double. The single echelon, organised in a single line, is used for small groups (a breakaway of fewer than eight riders, a team time trial). The double echelon, more effective, is made up of two lines: a descending one, on the windward side, made up of the riders who have taken their turn, and an ascending one, sheltered, getting ready to take a turn. This formation ensures continuous protection for all the riders.
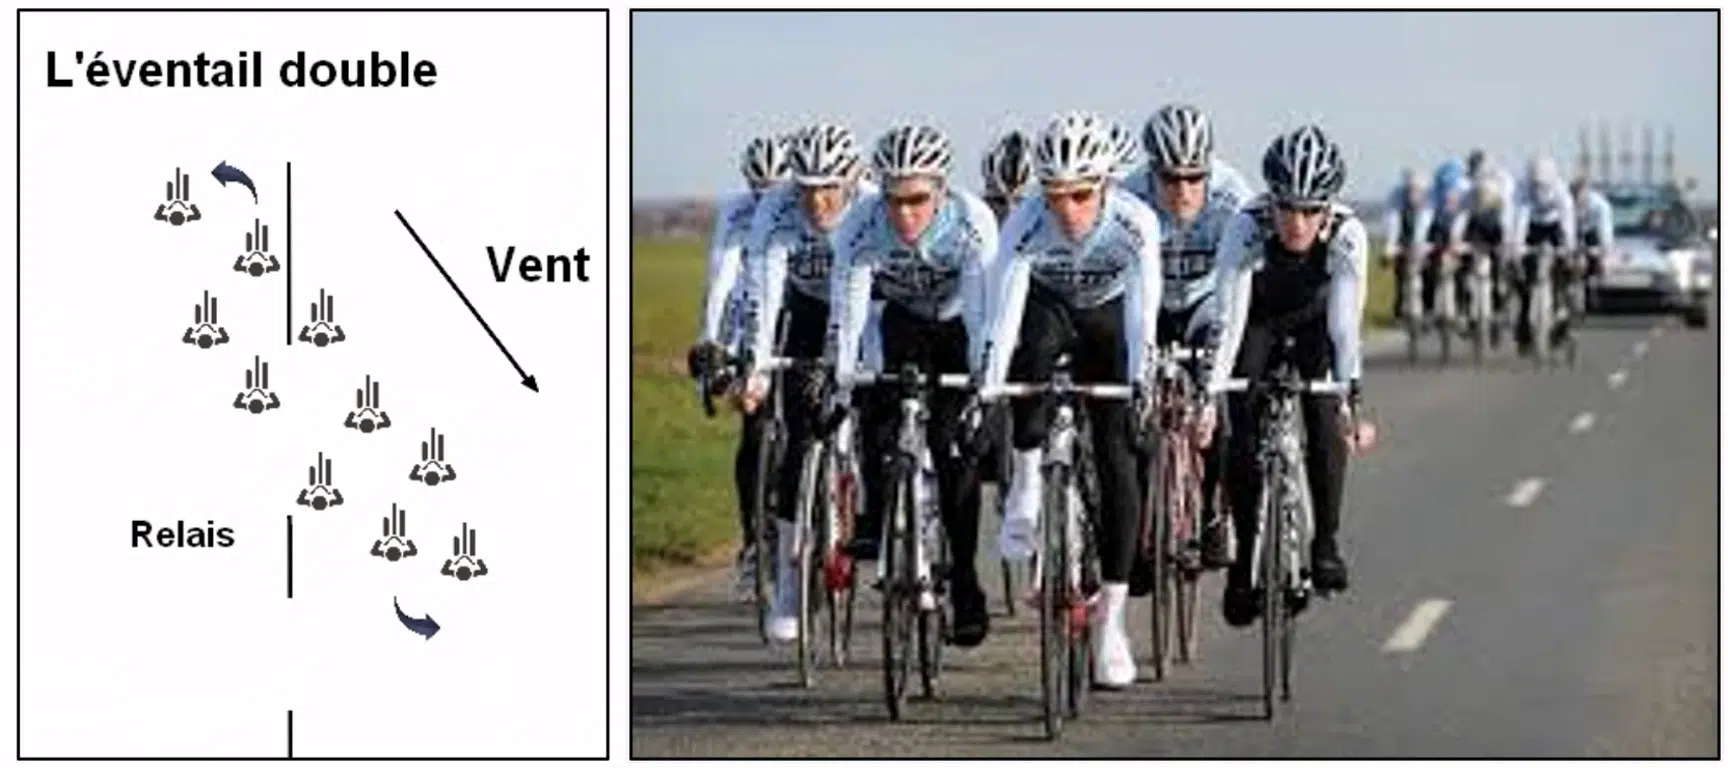
The isolated riders: the key to getting dropped
The double echelon requires at least about ten riders. In competition, a team can tighten the echelon by placing a strong rider near the edge of the road, on the side opposite the wind, reducing the number of protected riders and increasing the difficulty for opponents. When the crosswind is intense, this technique can fragment the peloton by creating decisive splits: the riders who fail to slot in find themselves exposed to the wind and suffer a drastic increase in drag, due to the break-up of the smooth, continuous airflow.
The sheltered riders benefit from a significant reduction in drag thanks to the wake effect and the lateral protection of their teammates. The isolated riders, on the other hand, must put in a far greater effort, which can lead to them being dropped and the peloton splitting into several groups. This aerodynamic aspect has cost leaders Tours de France.
CFD study of cyclists in an echelon
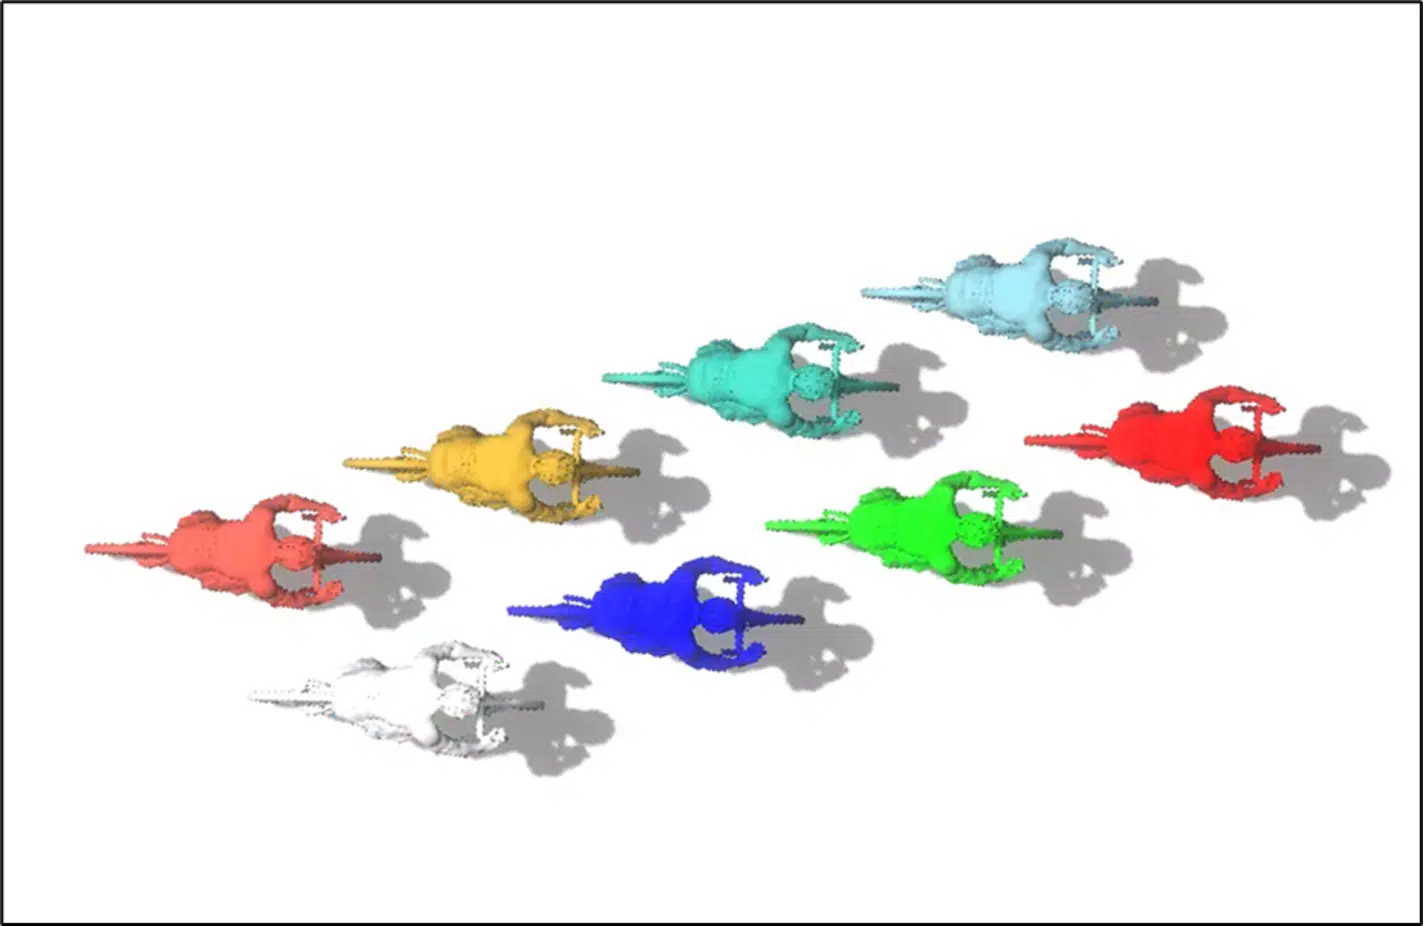
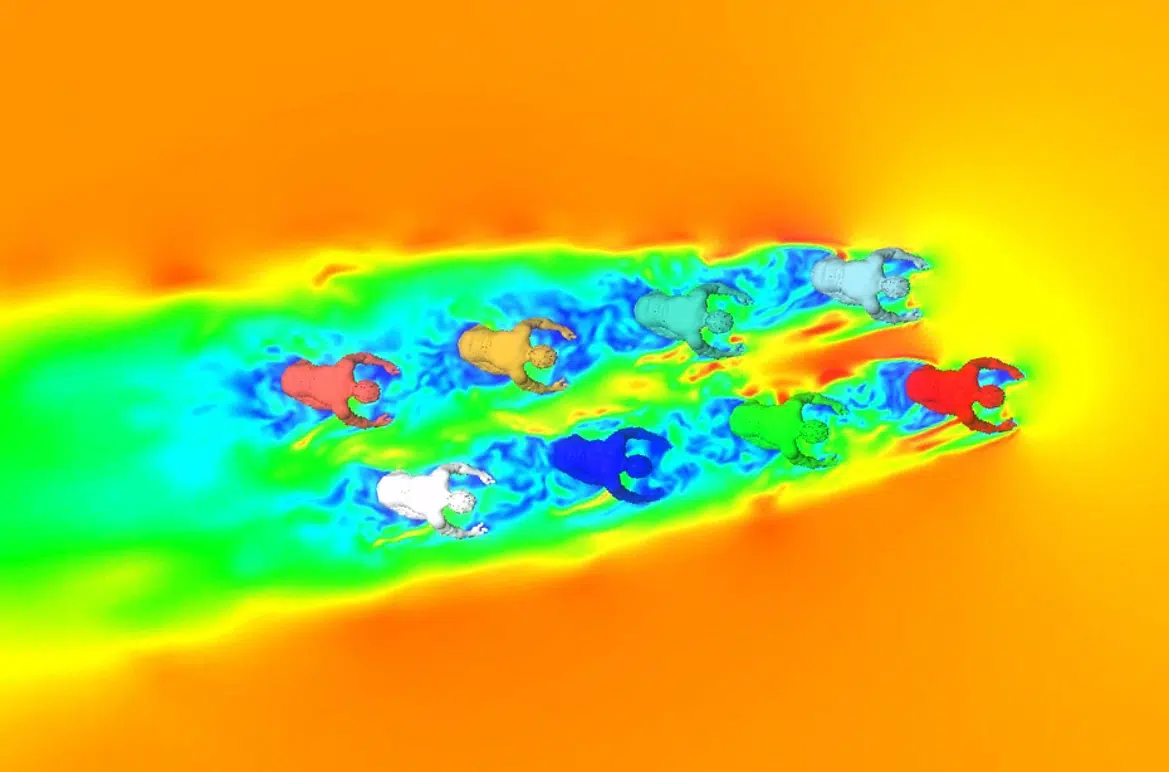
EOLIOS studied the double-echelon configuration of 8 cyclists when a crosswind appears, in order to confirm by CFD the effectiveness of this formation. The 3D model of the cyclists is identical to the previous one.
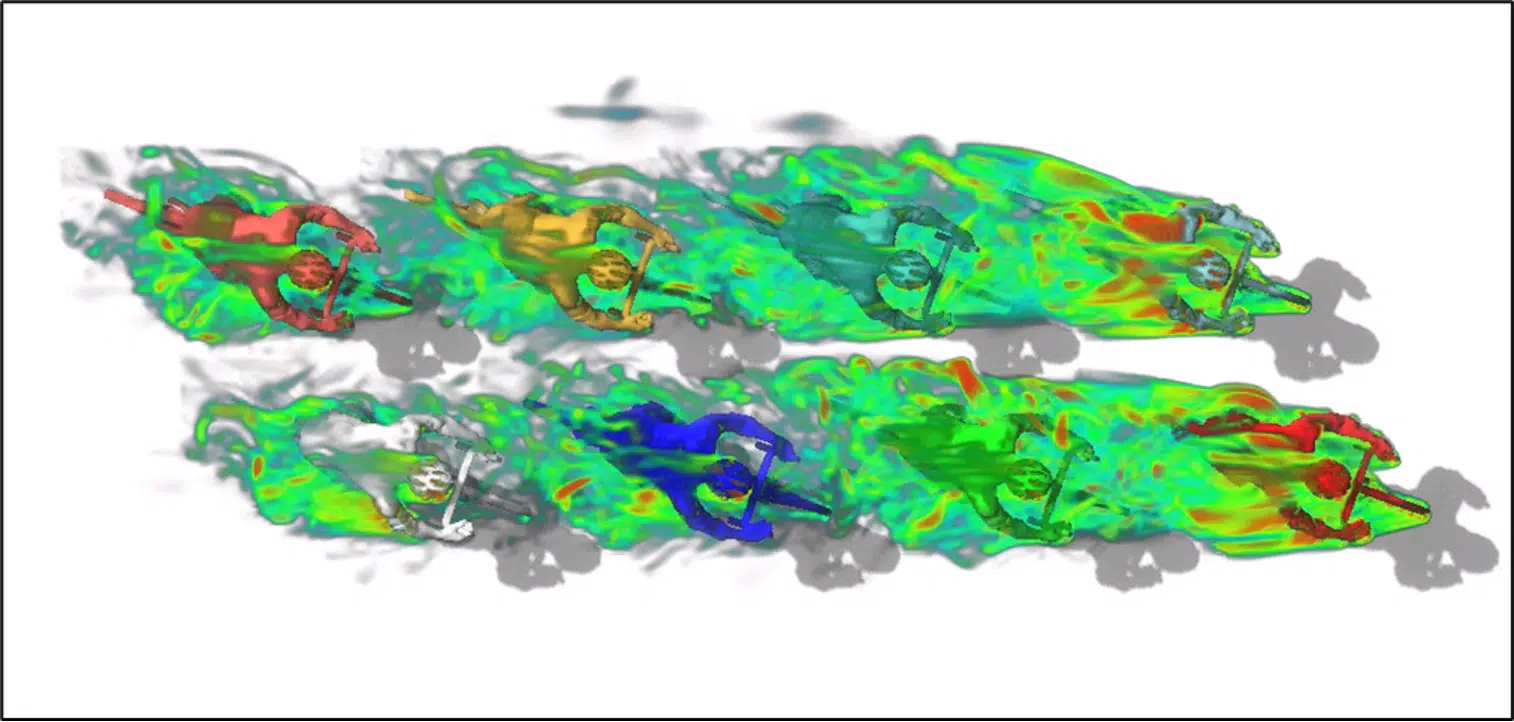
The distribution of air speeds shows that the protected cyclists encounter lower speeds; as in the classic peloton, they experience far less drag. The vorticity field confirms that the front riders disturb the flow the most.
Double echelon: −70% drag
The calculations show that the 6 protected cyclists feel on average only 30% of the drag experienced by each of the two front riders. This 70% reduction proves the effectiveness of the double echelon against crosswinds.
Optimising performance: the impact of CFD in competitive cycling
This CFD simulation study applied to a peloton is a voluntary initiative by EOLIOS to illustrate the technological advances and the concrete applications of CFD in competitive cycling. By analysing the aerodynamic drag and the strategic positions of the riders (with, for example, the crosswind-split phenomena), we have shown how these tools optimise performance at events such as the Tour de France.
Through this initiative, EOLIOS wishes to share with the general public and cycling enthusiasts the possibilities offered by CFD simulation, and to encourage a deeper understanding of the scientific and technological factors that influence this sport.
EOLIOS hopes that this study will inspire new research and applications of CFD in various sporting fields and beyond.
Sport, building, industry: our CFD engineers turn your flow challenges into concrete decisions.